The Mobile Vitals dashboard
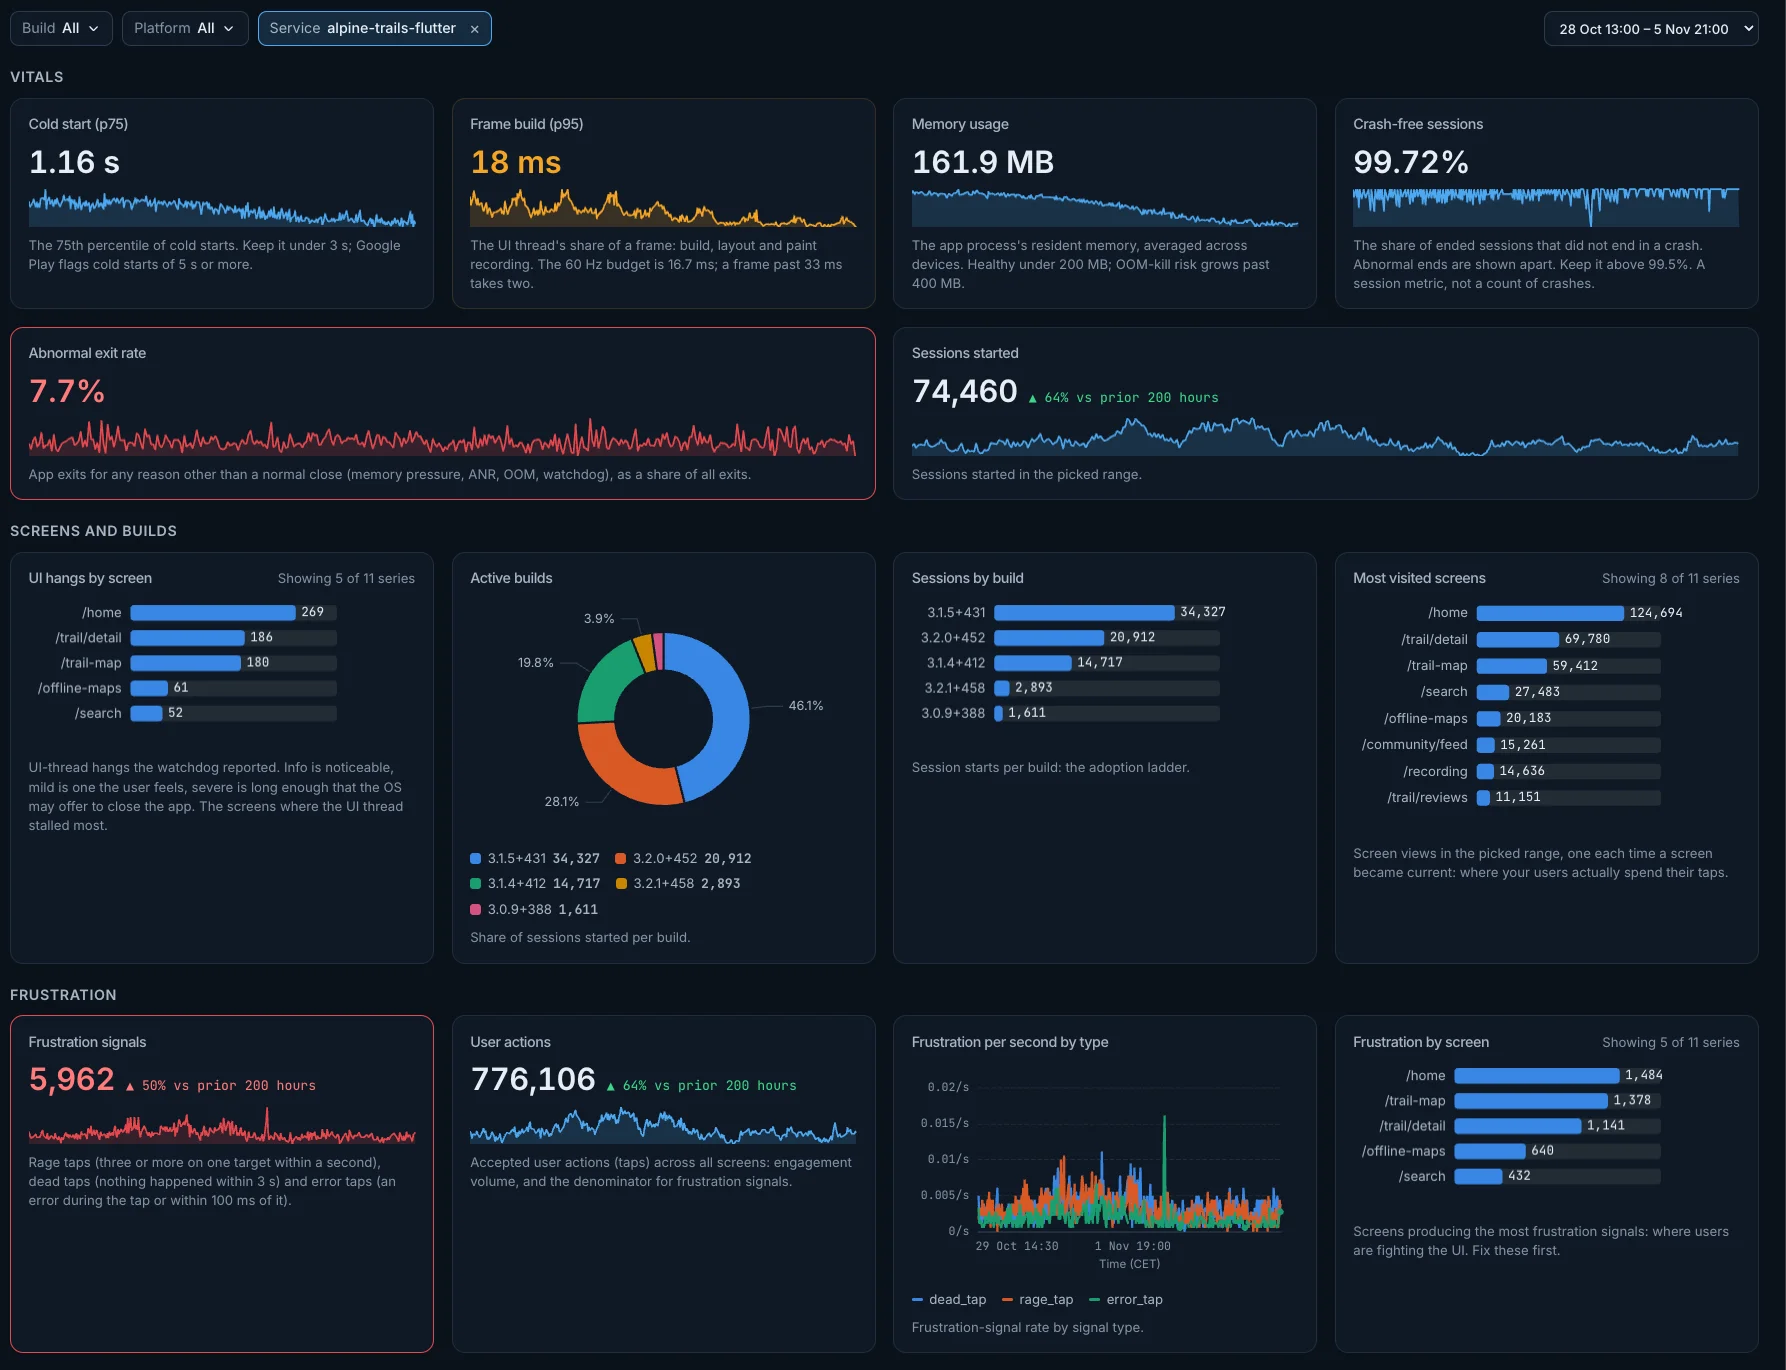
The six vitals of a mobile release at a glance: cold start, frame build, memory, crash-free sessions, abnormal exits and sessions started. Under them, the screens, builds and frustration behind the numbers.
Who it is for: The people who ship the mobile app: check it after each release and before a rollout widens.
Open it from Dashboards in the Observatory: choose Mobile Vitals. It is a built-in board, so it is read-only; Save a copy makes one you can change. How every panel reads the range, its colors and its empty states is on Reading a board.
The toolbar: the filters Build, Platform and Service, each All until you pick a value, and the time range. Each menu lists the values flutter.session.count carries in the range. Each panel below names the filters that narrow it.
Vitals
Cold start (p75)
Cold start time at the 75th percentile. Keep it under 3 s; Google Play flags cold starts of 5 s or more.
- How it is computed: The 75th percentile of
flutter.app.startup.durationfor cold starts (app.start.typecold). One figure for the whole picked range. - Better: Lower is better.
- Colors: The figure turns amber above 3 s and red above 5 s.
- Filters: Build, Platform and Service narrow it.
- Opens: its title opens the Metric screen on
flutter.app.startup.duration.
Frame build (p95)
The UI thread's share of a frame: build, layout and paint recording, at the 95th percentile. The 60 Hz budget is 16.7 ms; a frame past 33 ms takes two.
- How it is computed: The 95th percentile of
flutter.frame.build. One figure for the whole picked range. - Better: Lower is better.
- Colors: The figure turns amber above 16 ms and red above 33 ms.
- Filters: Build, Platform and Service narrow it.
- Opens: its title opens the Metric screen on
flutter.frame.build.
Memory usage
The app process's resident memory, averaged across devices. Healthy under 200 MB; OOM-kill risk grows past 400 MB.
- How it is computed: The average of
process.memory.usagefrom Flutter app processes (those that carryflutter.build.mode); a server process never counts here. One figure for the whole picked range. - Better: Lower is better.
- Colors: The figure turns amber above 200 MB and red above 400 MB.
- Filters: Build, Platform and Service narrow it.
- Opens: its title opens the Metric screen on
process.memory.usage.
Crash-free sessions
The share of ended sessions that did not end in a crash. Abnormal ends are shown apart and do not count against it. It is a session figure, not a count of crashes: the Crashes list counts crashes. Keep it above 99.5%.
- How it is computed: Crash-free sessions = 1 − crashed sessions / ended sessions, as a percent, the way Sentry counts it. Both come from
flutter.session.count: an ended session is one whosesession.statusis ok, errored, unhandled, crashed or abnormal, and only crashed counts against the figure. A range whose sessions all ended without a crash reads 100%. One figure for the whole picked range. - Better: Higher is better.
- Colors: The figure turns amber below 99.5% and red below 99%.
- No session ended: when no session ended in the range, it shows this instead of a figure: No session end recorded in this range, so crash-free sessions can't be computed.
- Filters: Build, Platform and Service narrow it.
- Opens: its title opens the Metric screen on
flutter.session.count.
Abnormal exit rate
App exits for any reason other than a normal close (memory pressure, ANR, OOM, watchdog), as a share of all exits. Exits are reported at the next launch and include exits in the background.
- How it is computed:
dartastic.app.exit.countwhereapp.exit.reasonis not normal, divided by all ofdartastic.app.exit.count, as a percent. One figure for the whole picked range. - Better: Lower is better.
- Colors: The figure turns amber above 1% and red above 3%.
- Filters: Build, Platform and Service narrow it.
- Opens: its title opens the Metric screen on
dartastic.app.exit.count.
Sessions started
Sessions started in the picked range.
- How it is computed:
flutter.session.countwheresession.statusis started. One figure for the whole picked range. - Better: Higher is better. Beside the figure, its change from the prior range of the same length: green when it moved the better way, red when it moved the other way.
- Filters: Build, Platform and Service narrow it.
- Opens: its title opens the Metric screen on
flutter.session.count.
Screens and builds
UI hangs by screen
The five screens where the UI thread stalled most. A UI hang is a UI-thread hang the watchdog reported. Info is noticeable, mild is one the user feels, severe is long enough that the OS may offer to close the app.
- How it is computed: Log records with
event.namedartastic.app.anr, every severity, counted per screen (the record'sapp.screen.name). Ranked bars, each figure for the whole picked range. - Filters: Build, Platform and Service narrow it.
- Opens: its title opens Logs.
Active builds
Each build's share of the sessions started.
- How it is computed: Sessions started (
flutter.session.countwheresession.statusis started), counted per build (app.build_id), the top eight builds. Slices of one whole, each figure for the whole picked range. - Filters: Build, Platform and Service narrow it.
- Opens: its title opens the Metric screen on
flutter.session.count.
Sessions by build
Session starts per build: the adoption ladder.
- How it is computed: Sessions started (
flutter.session.countwheresession.statusis started), counted per build (app.build_id), the top eight builds. Ranked bars, each figure for the whole picked range. - Filters: Build, Platform and Service narrow it.
- Opens: its title opens the Metric screen on
flutter.session.count.
Most visited screens
Screen views, one each time a screen became current: where your users spend their taps.
- How it is computed: Log records with
event.namedartastic.screen.view, counted per screen (the record'sapp.screen.name), the top eight. Ranked bars, each figure for the whole picked range. - Filters: Build, Platform and Service narrow it.
- Opens: its title opens Logs.
Frustration
Frustration signals
Rage taps (three or more on one target within a second), dead taps (nothing happened within 3 s) and error taps (an error during the tap or within 100 ms of it). A tap on a platform view, such as a webview or a map, is recorded but never counted as a dead or rage tap.
- How it is computed:
dartastic.frustration.signal.count. One figure for the whole picked range. - Better: Lower is better. Beside the figure, its change from the prior range of the same length: green when it moved the better way, red when it moved the other way.
- Colors: The figure turns amber above 25 and red above 100.
- Filters: Build, Platform and Service narrow it.
- Opens: its title opens the Metric screen on
dartastic.frustration.signal.count.
User actions
Accepted user actions (taps) across all screens: how much people use the app, and the base for frustration signals.
- How it is computed:
dartastic.action.count. One figure for the whole picked range. - Better: Higher is better. Beside the figure, its change from the prior range of the same length: green when it moved the better way, red when it moved the other way.
- Filters: Build, Platform and Service narrow it.
- Opens: its title opens the Metric screen on
dartastic.action.count.
Frustration per second by type
The frustration-signal rate by signal type.
- How it is computed: The per-second rate of
dartastic.frustration.signal.count, one line perdartastic.frustration.signal.type. Lines, one point per step across the picked range. - Filters: Build, Platform and Service narrow it.
- Opens: its title opens the Metric screen on
dartastic.frustration.signal.count.
Frustration by screen
The five screens producing the most frustration signals: where users are fighting the UI. Fix these first.
- How it is computed:
dartastic.frustration.signal.count, counted per screen (app.screen.name). Ranked bars, each figure for the whole picked range. - Filters: Build, Platform and Service narrow it.
- Opens: its title opens the Metric screen on
dartastic.frustration.signal.count.