
Dartastic Observatory
Fullstack Observability Where Dart and Flutter Are First Class.
Dartastic Observatory is an observability platform tuned for Dart and Flutter: traces, logs, metrics, pre-built dashboards, and crash symbolization, all speaking native OpenTelemetry, with an integrated private package registry.
Dartastic Observatory works best with Dartastic Native OTel. A Dartastic Native OTel license is included in every Dartastic Observatory subscription.
Dartastic Observatory takes OTel from any source - web apps, Go microservices, Node servers, nginx, Java monoliths, anything that generates OTel.
SHARED
Dartastic Cloud Observatory
Isolated observability on shared infrastructure. Nothing to provision, telemetry in minutes.
DEDICATED
Dartastic Hosted Observatory
Your own observability platform at your own subdomain, live in minutes. Pay by the box, not by the byte.
YOUR INFRASTRUCTURE
Dartastic Self-hosted Observatory
The whole platform inside your own network. Your keys, your cluster, and nothing leaving your perimeter.
Every Dartastic Observatory Includes
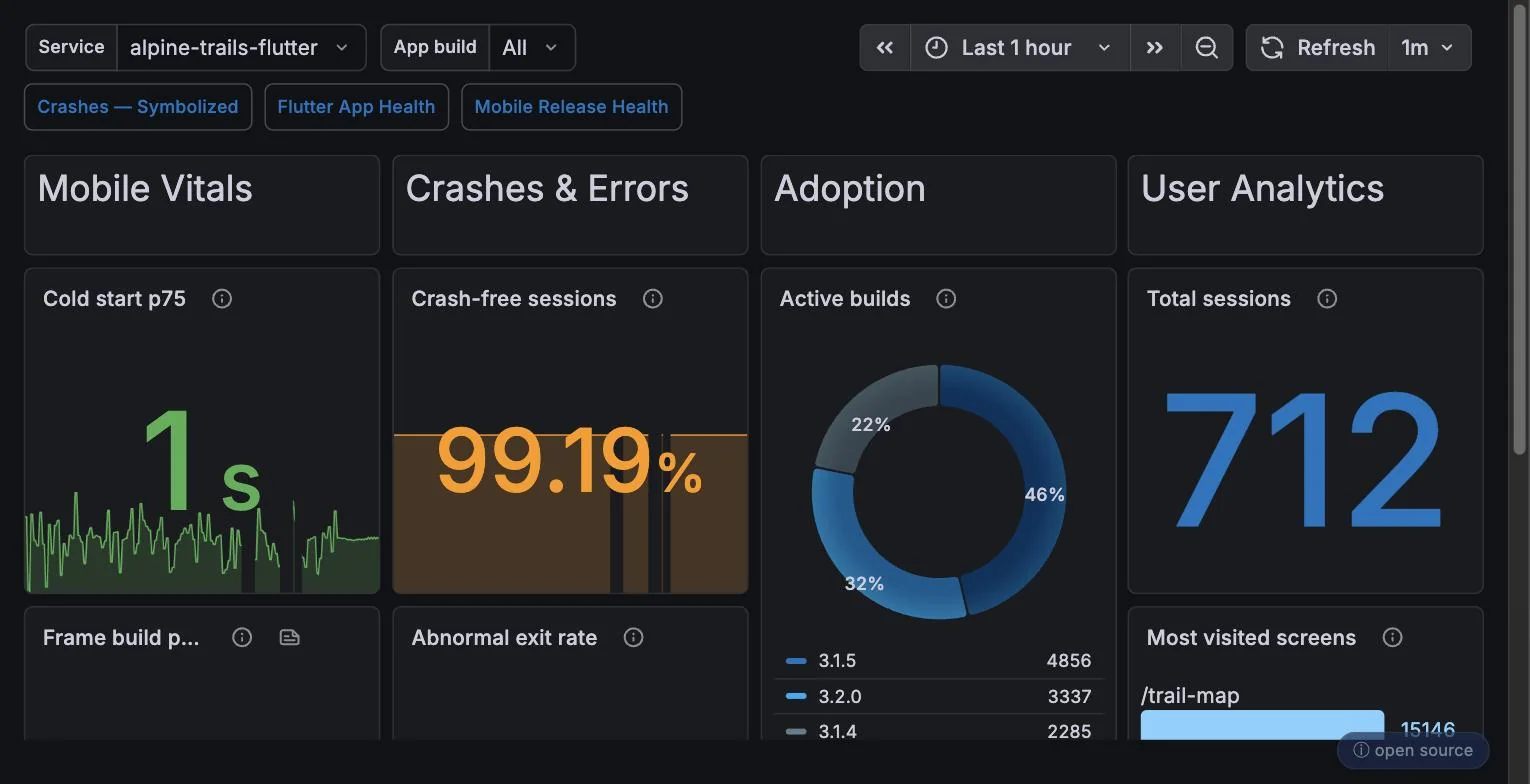
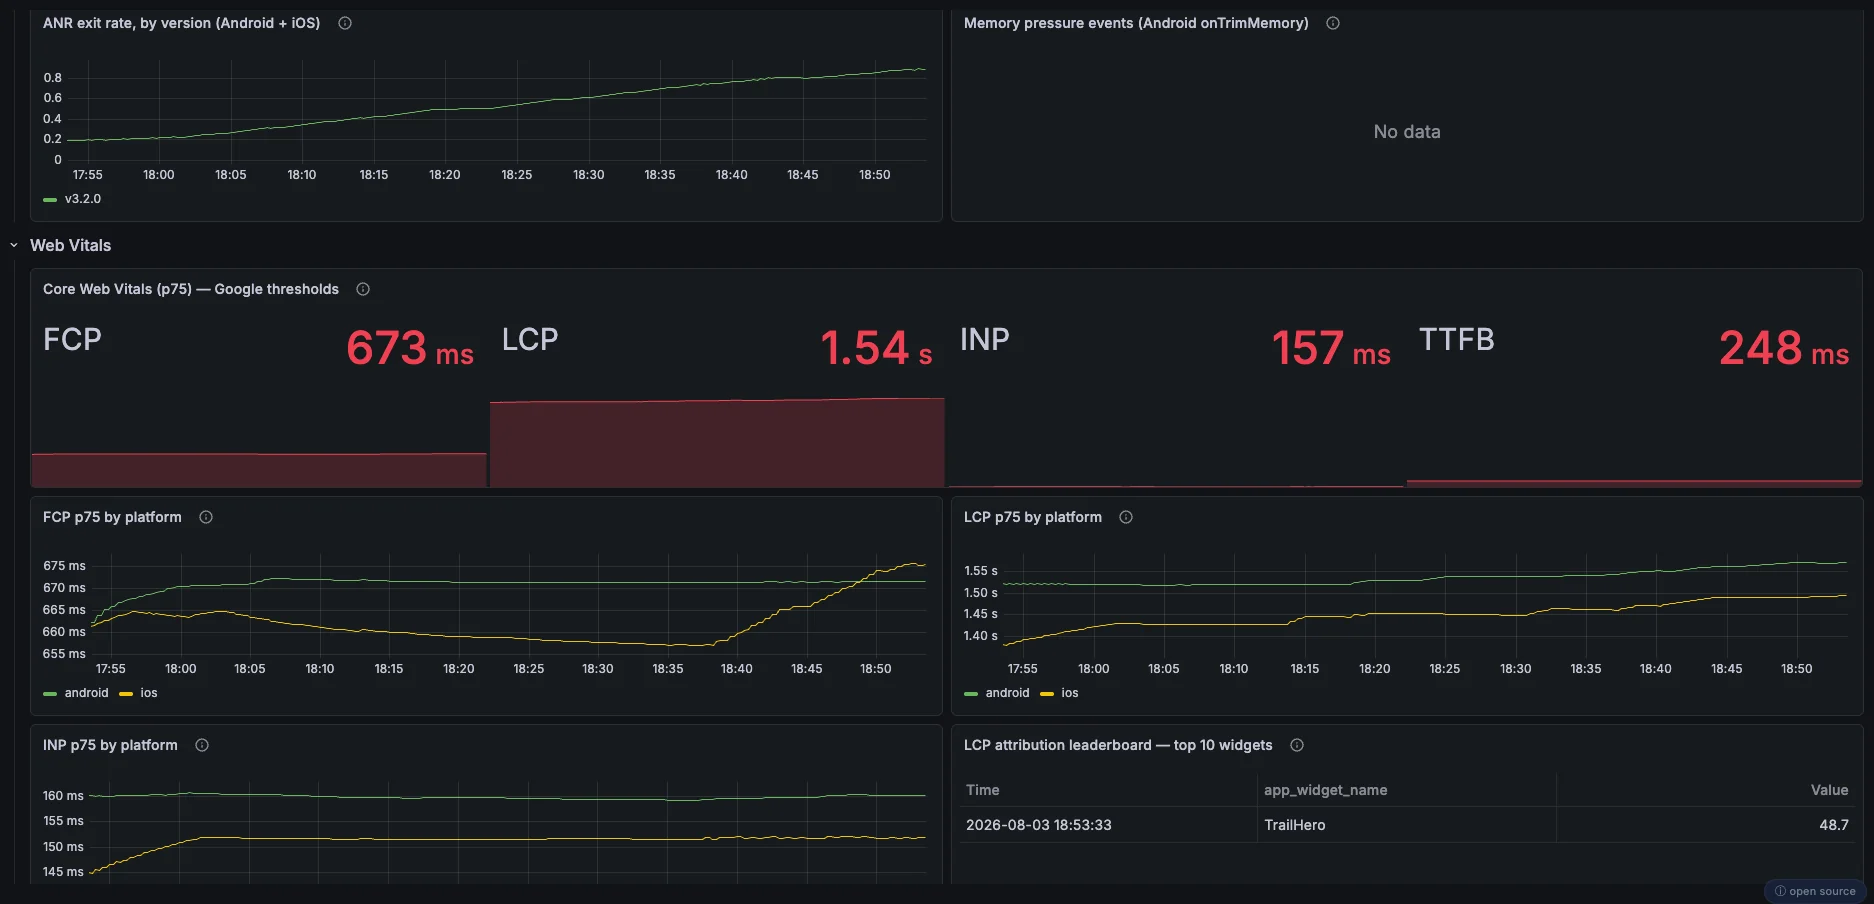
Hosted or Cloud, you get the same Flutter-tuned product: dashboards that already know Flutter, crash symbolization, native OpenTelemetry ingest, and a private package registry.
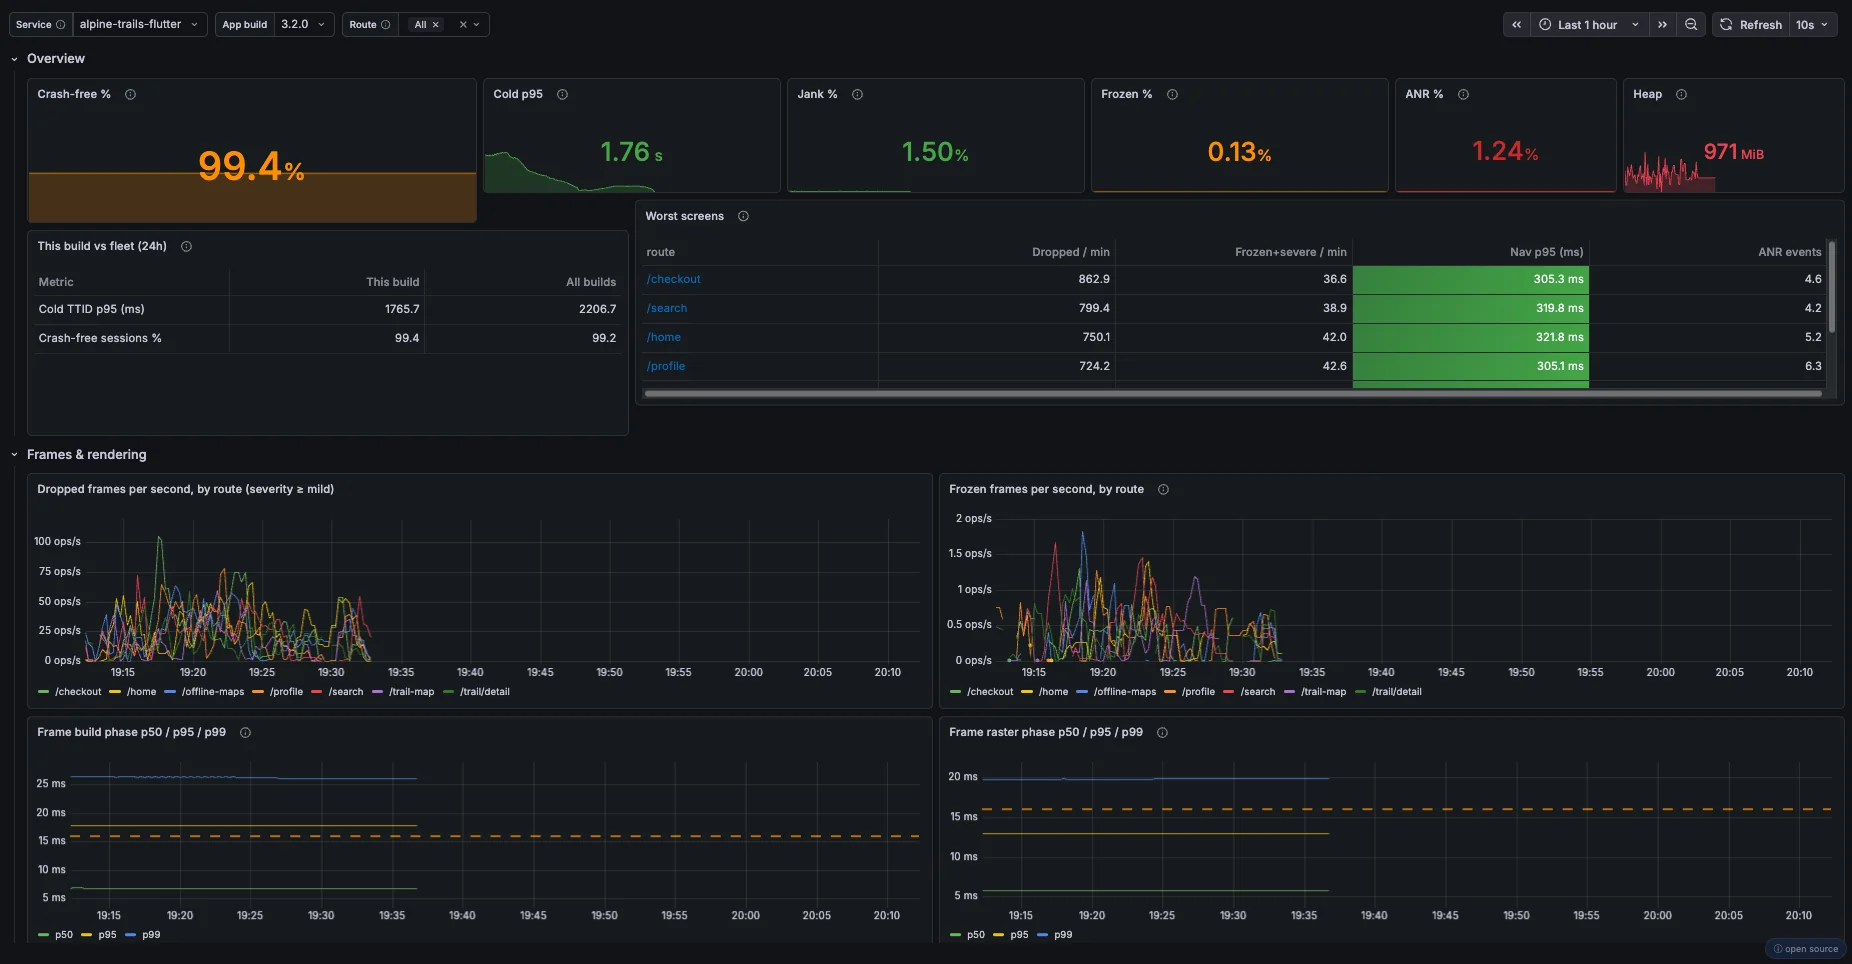
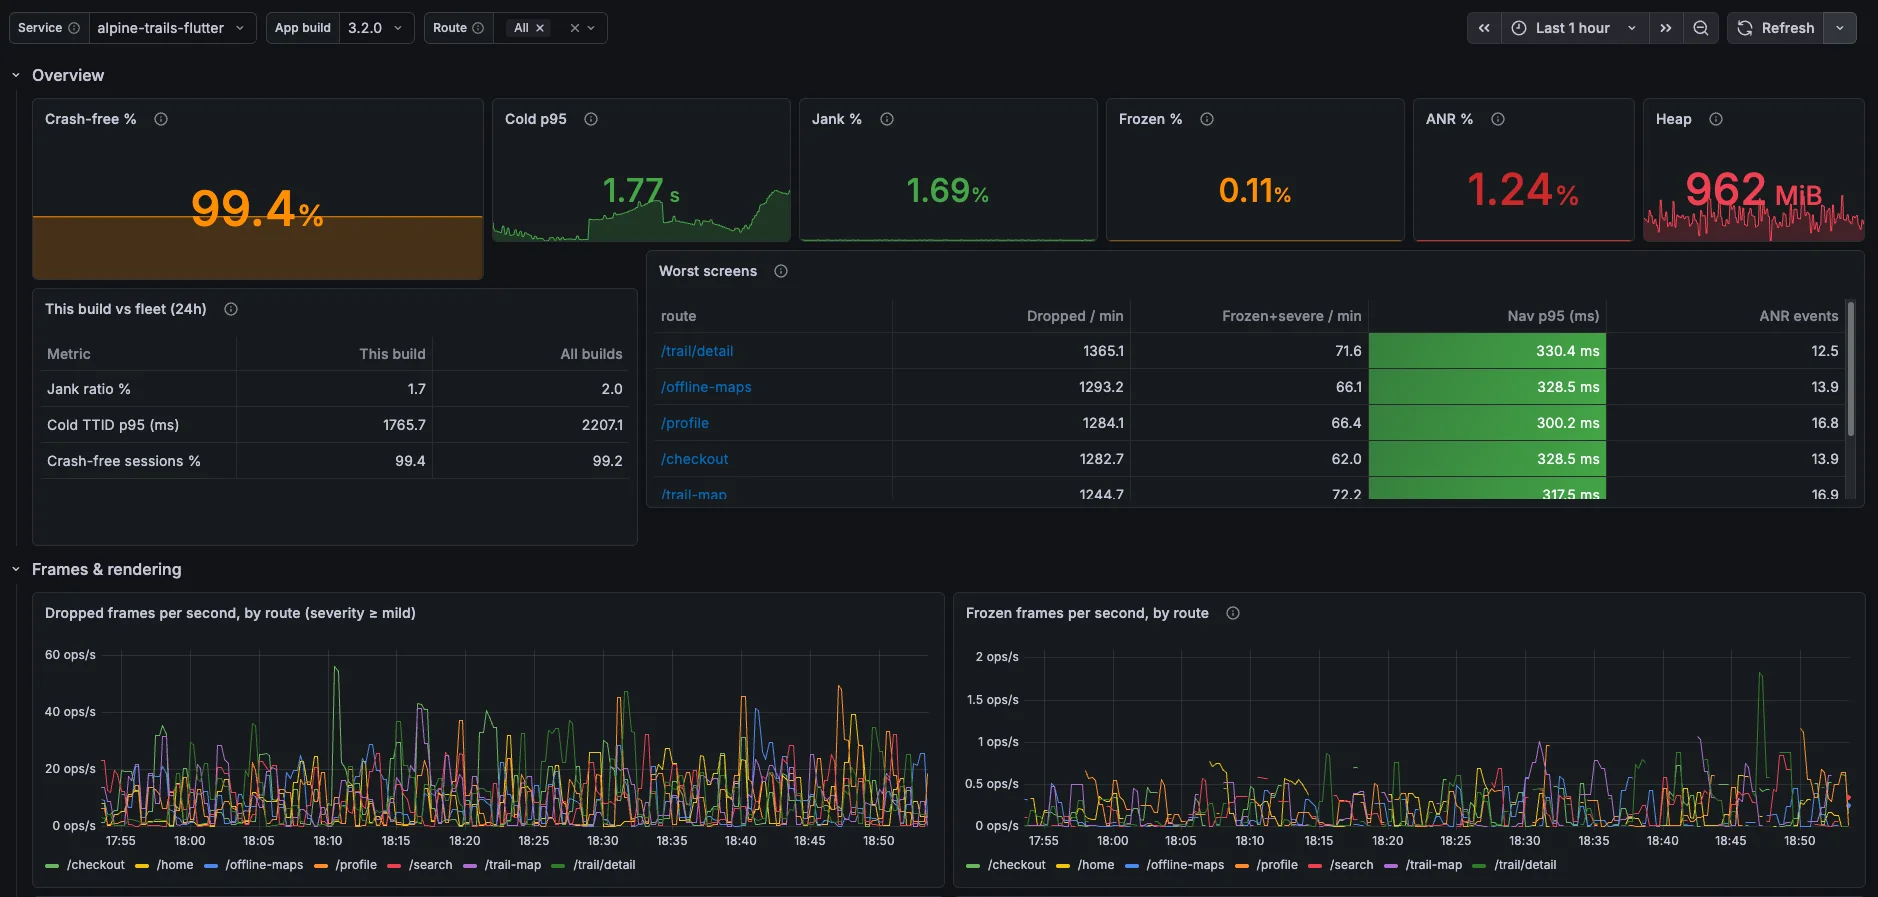
Flutter App Health
- Cold startup p50 / p95
- Frame build vs raster times, jank ratio
- Top janky routes, frozen frames
- Navigation durations
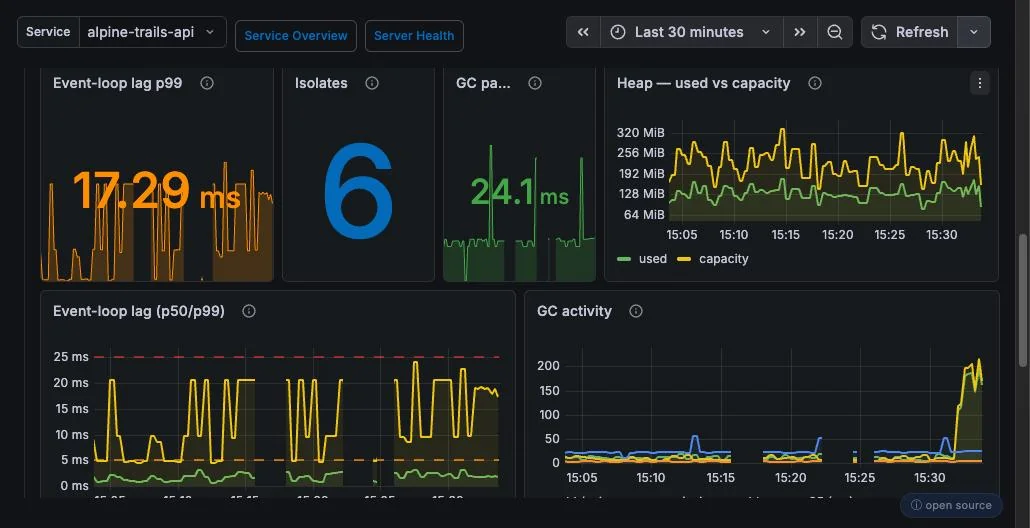
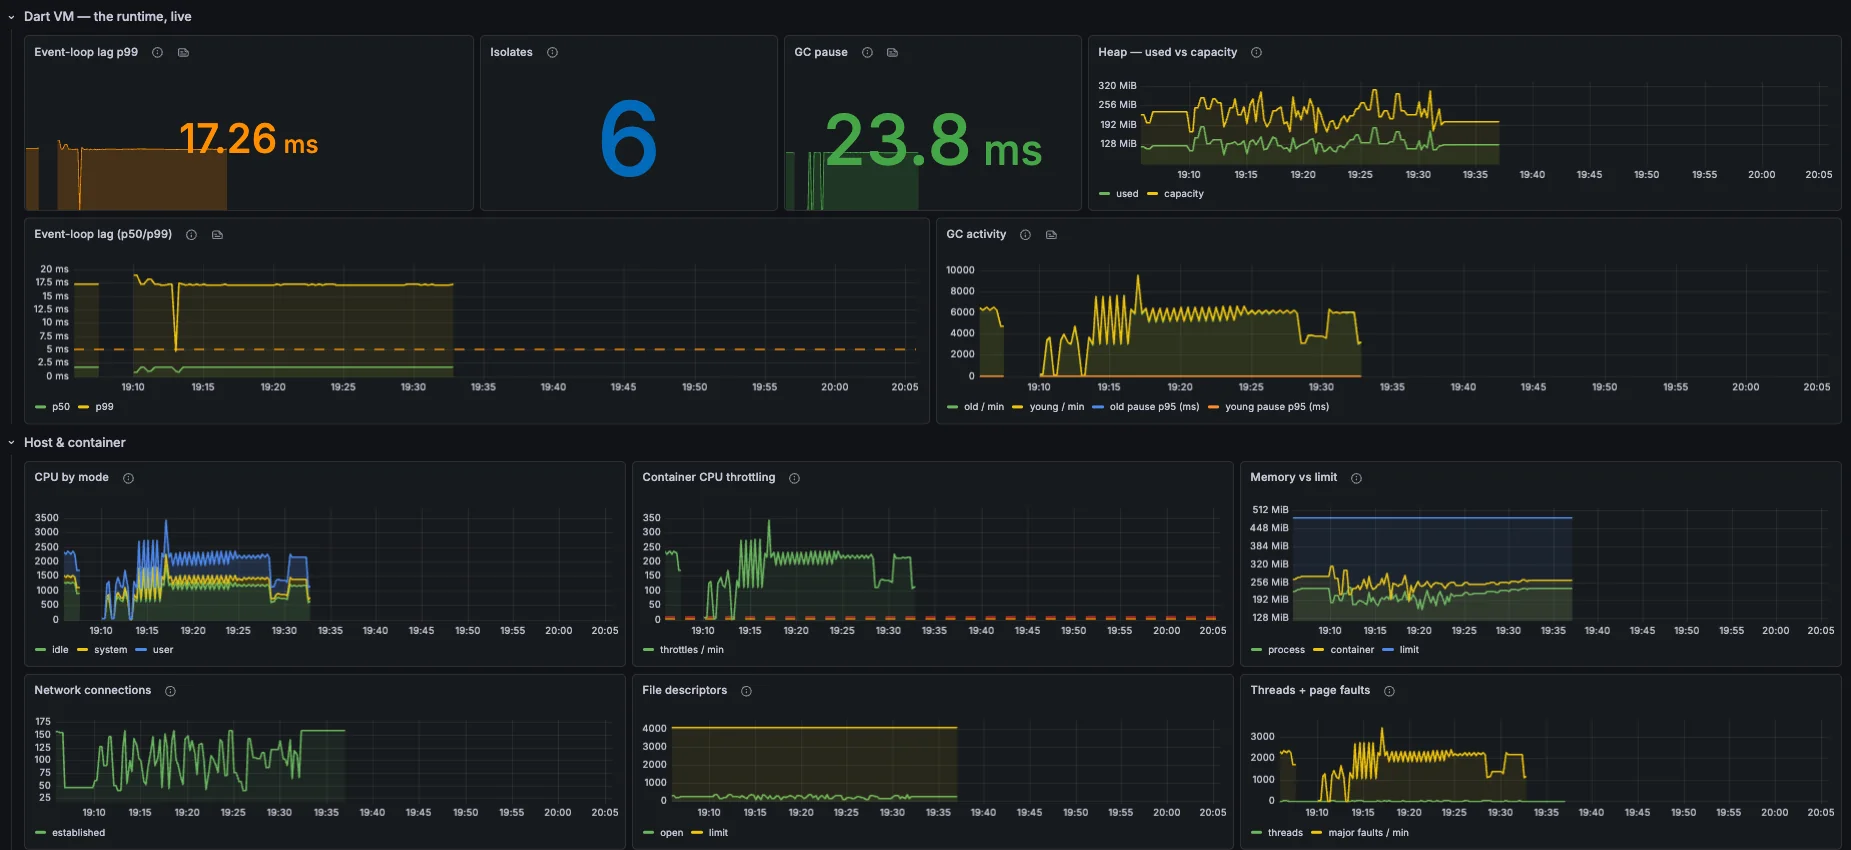
- Dart heap and GC frequency
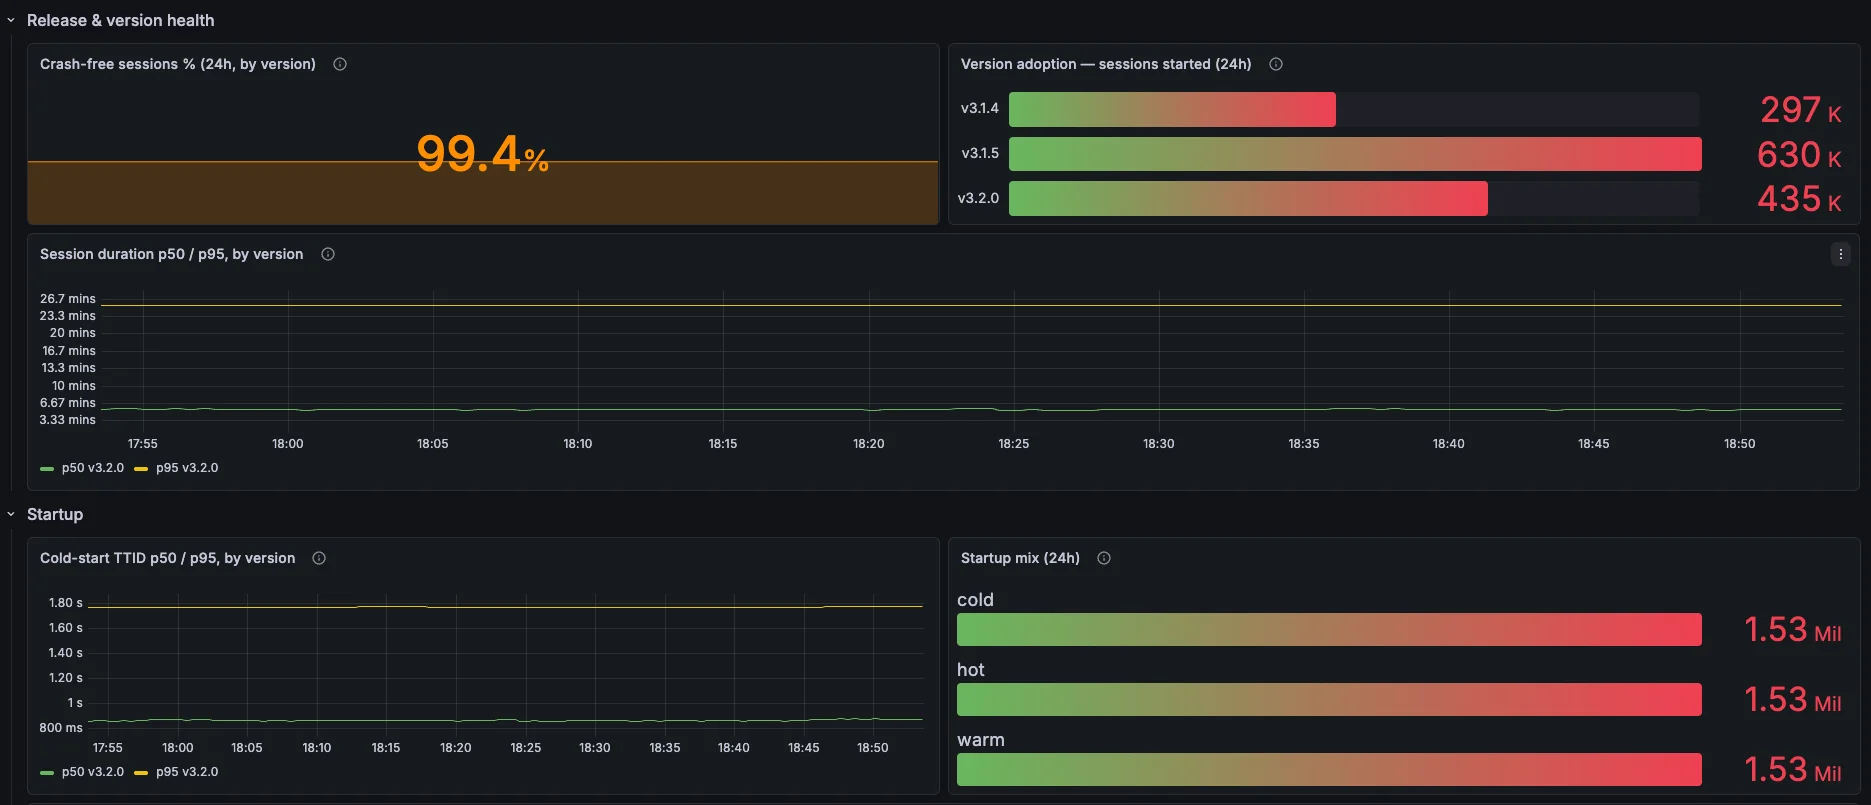
Mobile Release Health
- Web Vitals for mobile: LCP, INP, FCP, TTFB p75
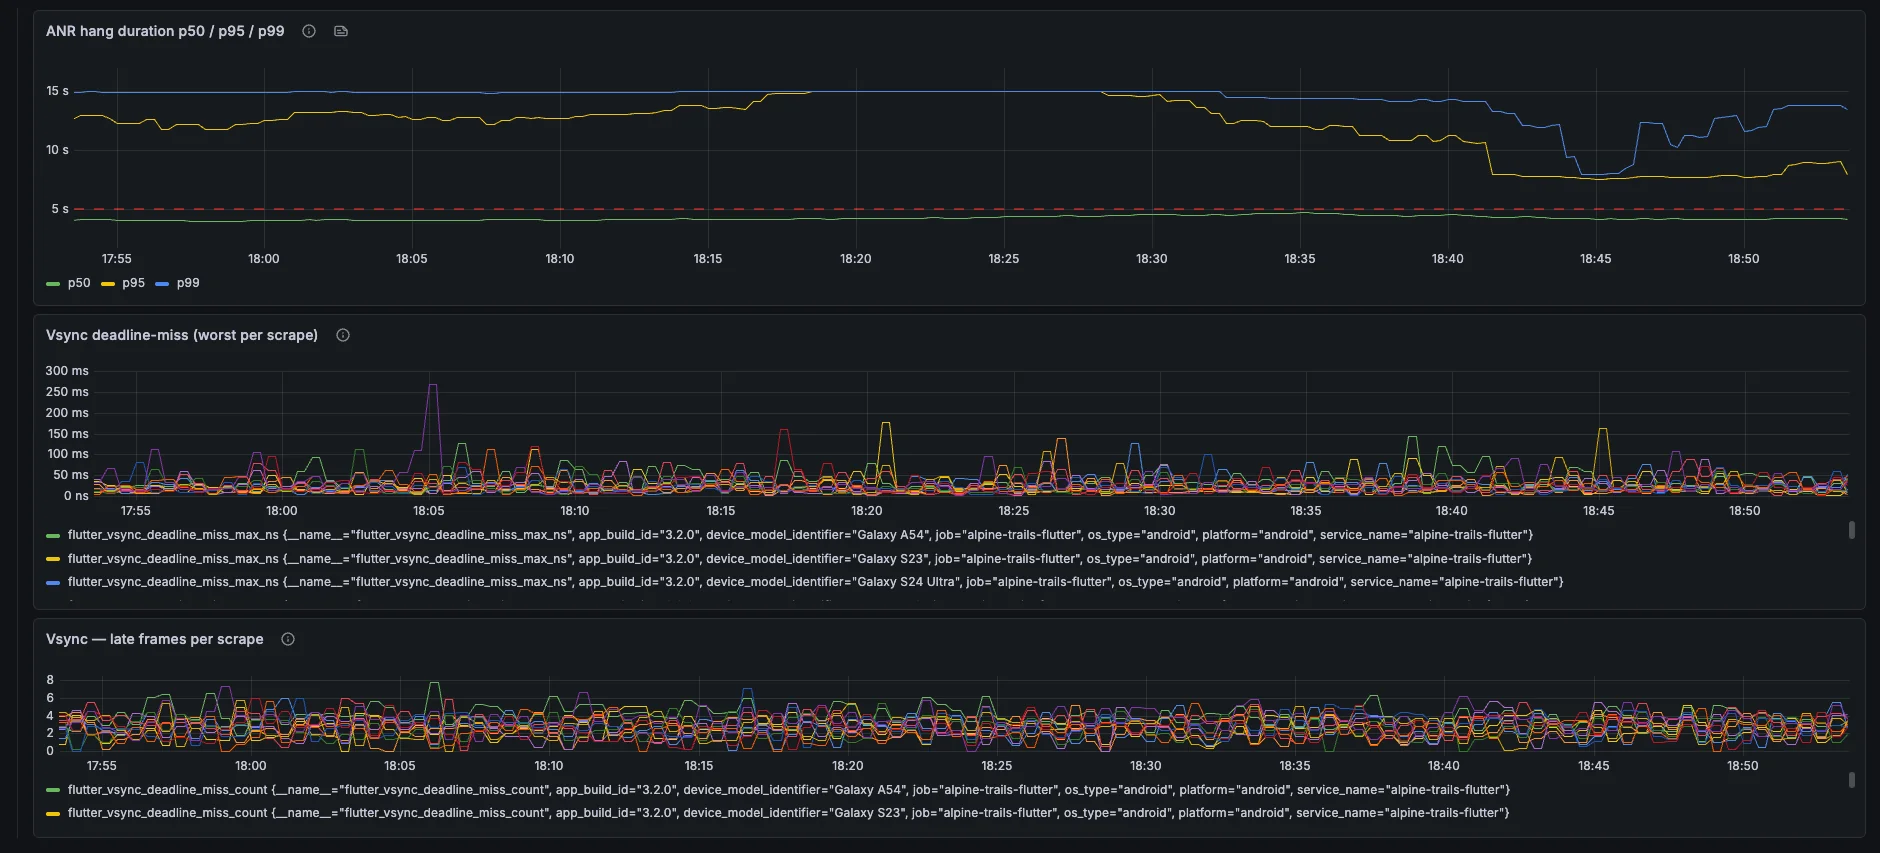
- App exits: OOMs and ANRs, per release
- Flaky-request rate and reasons
- Memory pressure, battery, low-power share
- iOS thermal state
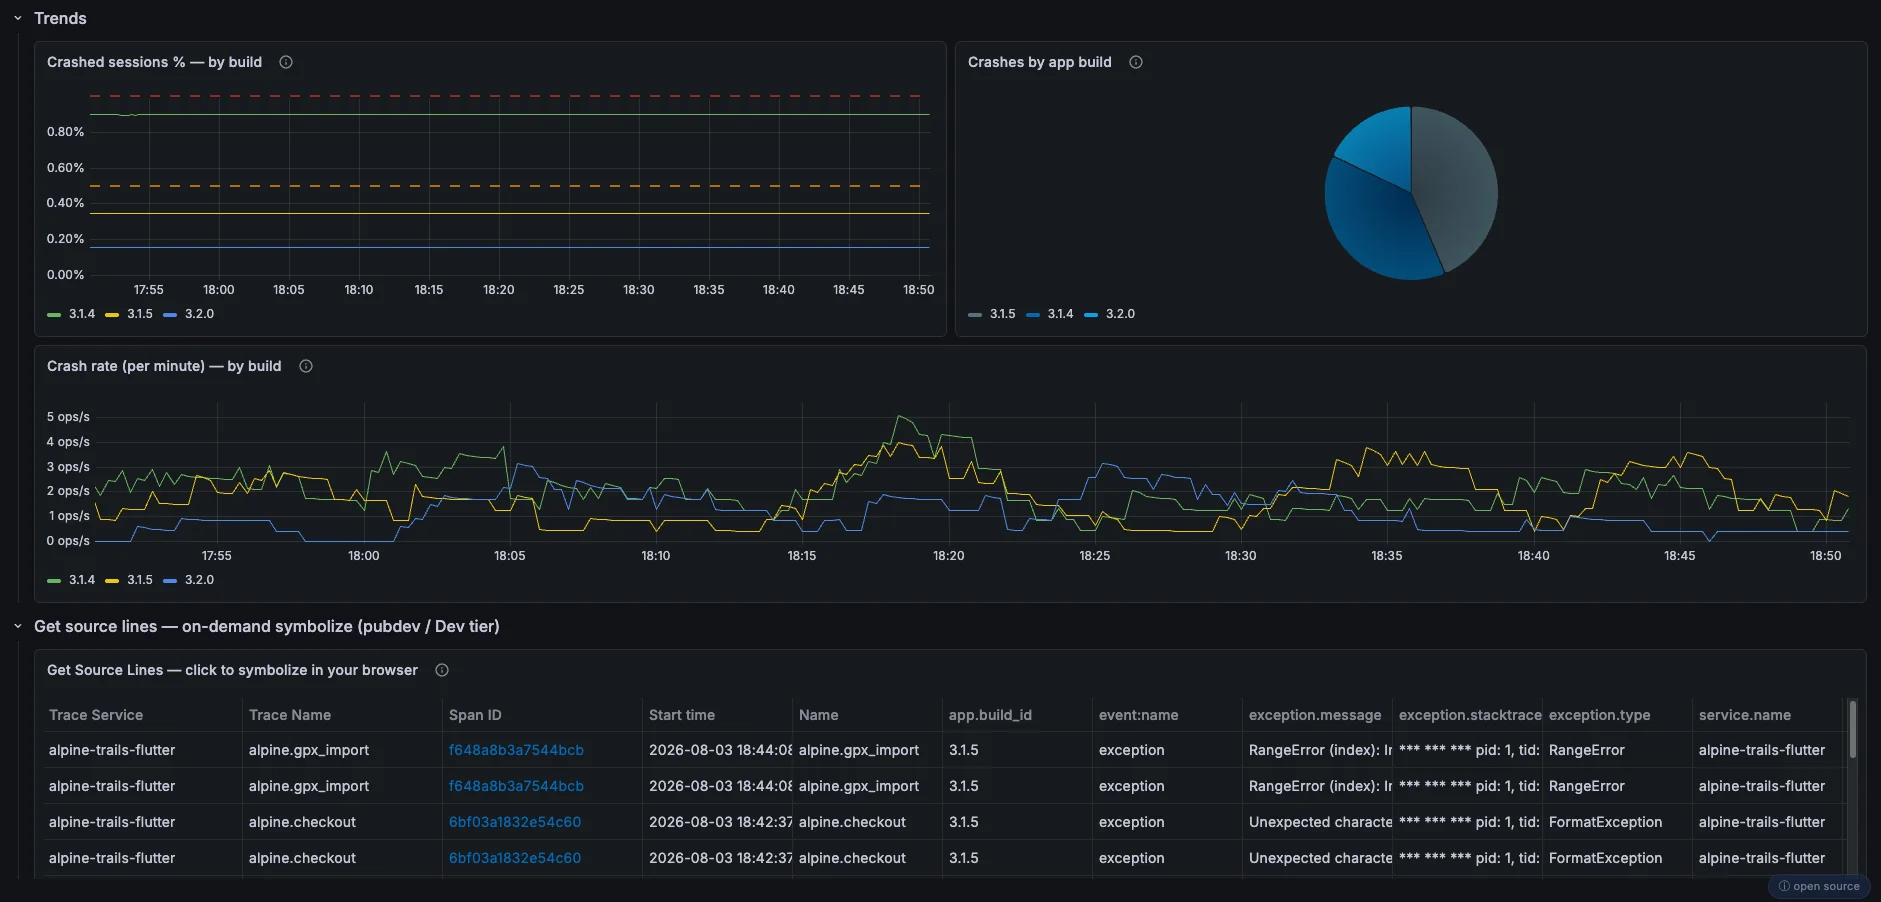
Crashes, Symbolized
- Production crashes with the trace that caused them
- One click from obfuscated frames to source lines
- Symbols resolved where your data lives
PRIVATE OBSERVABILITY
Dartastic Hosted Observatory
A dedicated stack, with unlimited seats. One tier price, plus two meters you can see: RUM sessions by replay fidelity, and backend ingest. Each tier includes an allowance and you buy prepaid packs beyond it, so there is no overage bill at the end of the month.
- One customer, one box. Nothing is multi-tenant. Your telemetry, symbols, and private packages never share a process, disk, or database with another customer.
- Live in minutes. Subscribe, pick your slug, and your platform auto-provisions on a subdomain of dartastic.io at
<slug>.dartastic.io, with TLS, usually in 5 to 15 minutes. - Your data stays yours. It lives on your box, exportable any time, with hourly retention-locked backups even root cannot destroy.
- Customized for Dart and Flutter: Fleet Health, mobile metrics, slow-widget identification - tools that fit.
- Dartastic Symbolizer shows source-code lines for production errors, right in your dashboards.
Subscribe to spin up your box
Pick a tier and subscribe. You'll choose your slug (<slug>.dartastic.io) in onboarding right after. The box starts building in parallel and is usually live in 5 to 15 minutes.
SHARED OBSERVABILITY
Dartastic Cloud Observatory
Start fast, nothing to provision. Shared, hard-isolated infrastructure with two meters you can see: backend bytes across spans, logs and metrics on one allowance, and RUM sessions priced by replay fidelity. Prepaid packs beyond the allowance, so there is never an overage bill.
- No box to provision. Subscribe, mint an ingest key, point your exporter, and telemetry flows. No slug to pick, no platform to wait on.
- One unified byte meter. Spans, logs, and metrics all count against one allowance. No five separate meters to reconcile.
- RUM priced by fidelity. Every session can be replayed. You pay for how much of it you chose to capture, from an event timeline up to full pixel replay, and never for sessions you did not upload.
- Hard multi-tenant isolation. Your data is structurally separated from every other tenant and stamped at the edge from your signed key, never trusted from the client.
- Grow into a box. When you outgrow Cloud, move up to Hosted for your own dedicated machine. Your instrumentation comes with you.
- Customized for Dart and Flutter: Fleet Health, mobile metrics, and slow-widget identification.
- Dartastic Symbolizer shows source-code lines for production errors, right in your dashboards.
- Dartastic Pub included. A private package registry on shared infrastructure. Cloud Pro includes Pub Pro, so supply chain policy applies to every dependency your apps pull.
How Cloud pricing works
- $39 / month, Cloud Dev. Full observability platform on the Native OTel Dev engine.
- $129 / month, Cloud Pro. Everything in Cloud Dev, upgraded to the Dartastic Native OTel Pro.
- 10 GB / month included. One unified byte meter across spans, logs, and metrics. Roughly 33 million spans a month.
- +$10 per 25 GB pack. Add prepaid volume packs anytime, as many as you like. Prepaid, so no surprise overage bill.
- 30-day metric retention. 14-day trace and log retention.
- 7-day free trial. Card required, no charge during the trial, cancel anytime. Extend once for another 7 days.
Start your free 7-day trial
A card is required to start; you will not be charged during the trial and can cancel anytime before it ends.
YOUR INFRASTRUCTURE
Dartastic Self-hosted Observatory
Lives on your network. The whole platform installs inside your own cluster: Dartastic Observatory, your private Dartastic Pub registry, Dartastic Symbolizer, and your own private control plane.
Your apps send telemetry to your own cluster, inside your own network. Updates arrive as signed bundles you import on your own schedule.
- Unlimited sessions at every RUM fidelity, unlimited ingest, retention and seats.
- Your cluster, your keys, your control plane. No Dartastic runtime dependency.
- We give you a Helm chart and you configure it to fit your cluster. We do not size your hardware.
- Dartastic Pub Enterprise with an offline mirror of public packages, and Dartastic Symbolizer.
- Business support included, delivered without remote access.
Every session can be replayed. You choose how much of it you keep.
RUM is one product with four fidelity levels. A session bills at the highest fidelity that actually uploaded, so a session where nothing went wrong can cost you nothing at all.
| Fidelity | What the replay shows | Per 1,000 sessions |
|---|---|---|
| Events | The full timeline: screens, network, spans, ANR and crashes. No visuals. | $0.50 |
| Wireframe | Everything in Events, plus a widget outline replay. No text or pixels leave the device. | $2.00 |
| Masked | Everything in Events, plus a blocked out replay with no readable text. | $3.00 |
| Pixel | Everything in Events, plus full fidelity pixel replay. What the user saw. | $5.00 |
Fidelity is your call
Set it per app, and per screen as that ships. Most teams land on Wireframe once legal has looked at it, and reach for Masked or Pixel only where someone has to see the screen.
Capture mode is not priced
Buffer on device and upload only when something breaks, or stream every frame. That is an engine switch. You pay for what uploads, so the choice sets its own price.
No overage bills
Each tier includes an allowance and you buy prepaid packs beyond it. When a fidelity pack runs out, capture steps down a level instead of producing an invoice.
Self-hosted has no metering. Unlimited sessions at every fidelity. See Self-hosted.
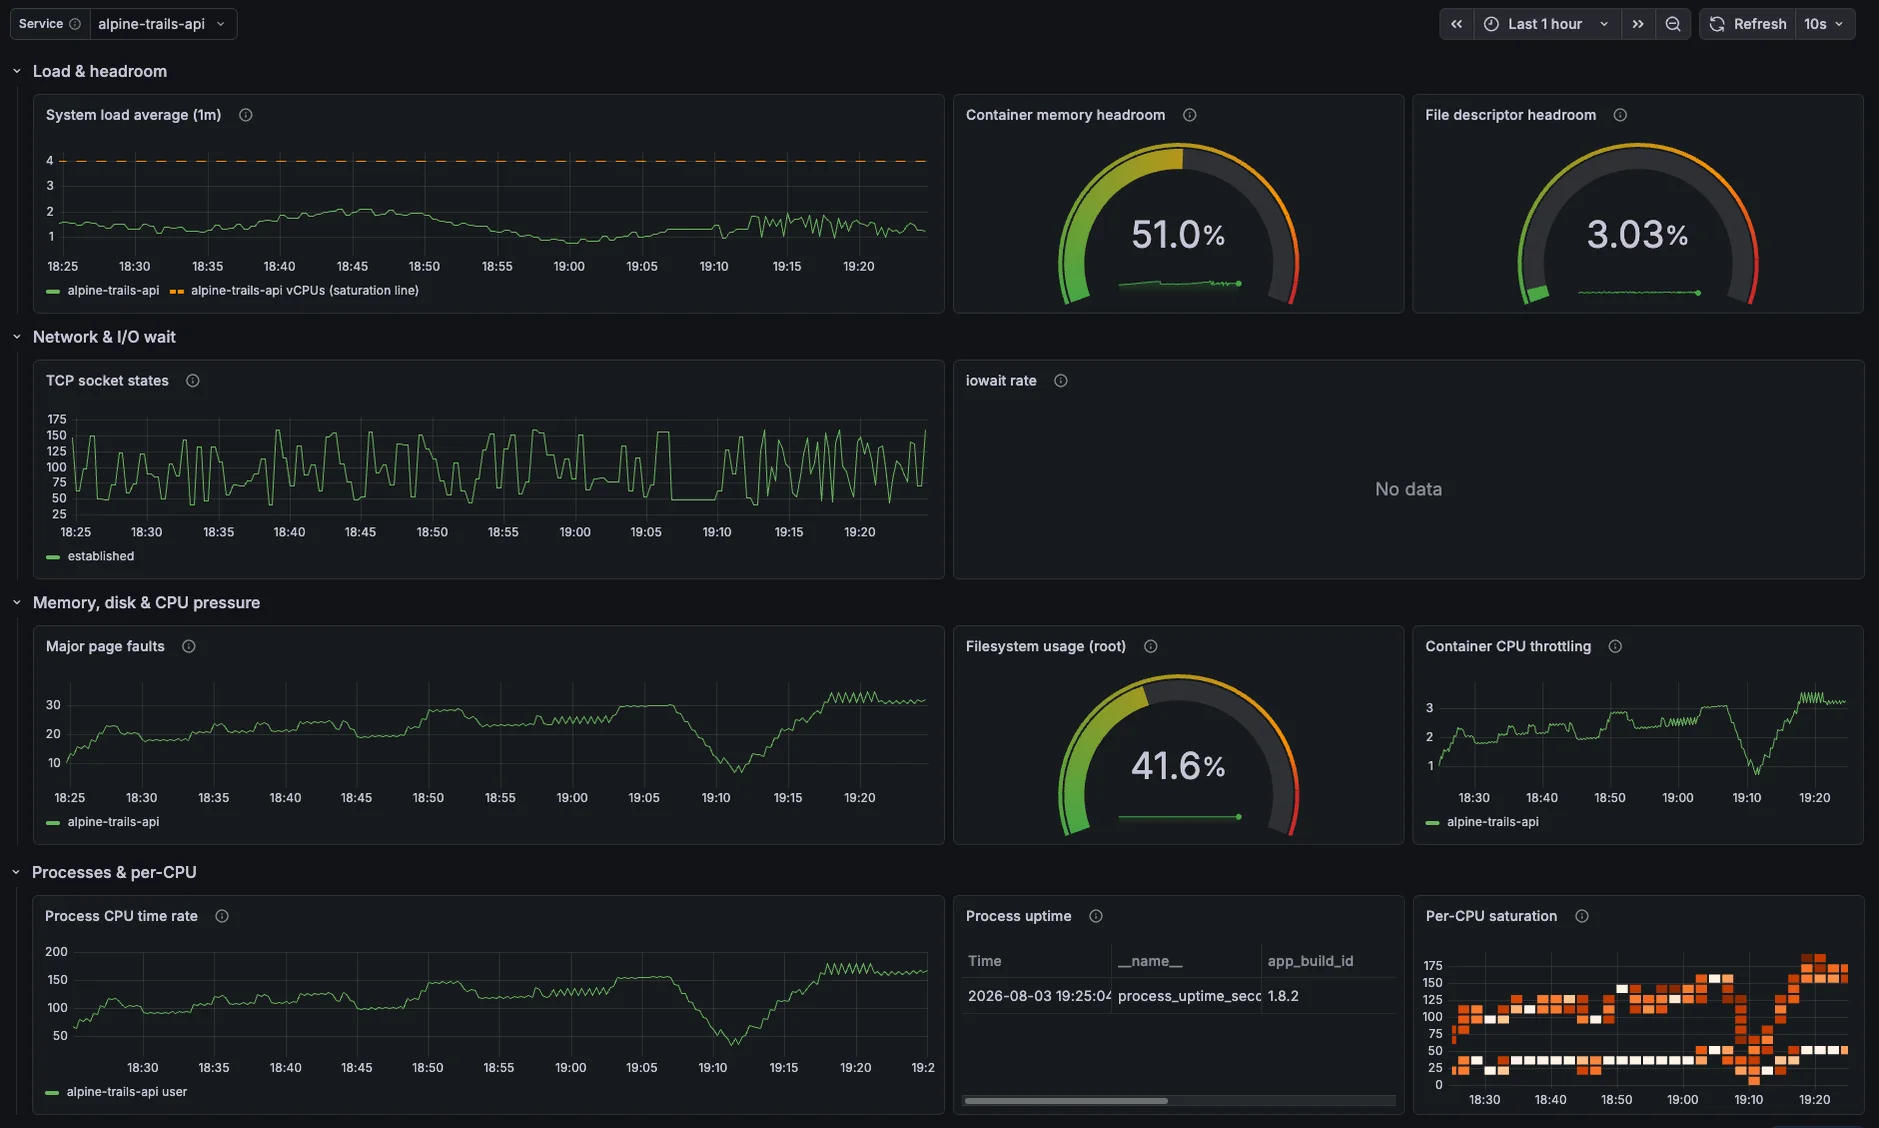
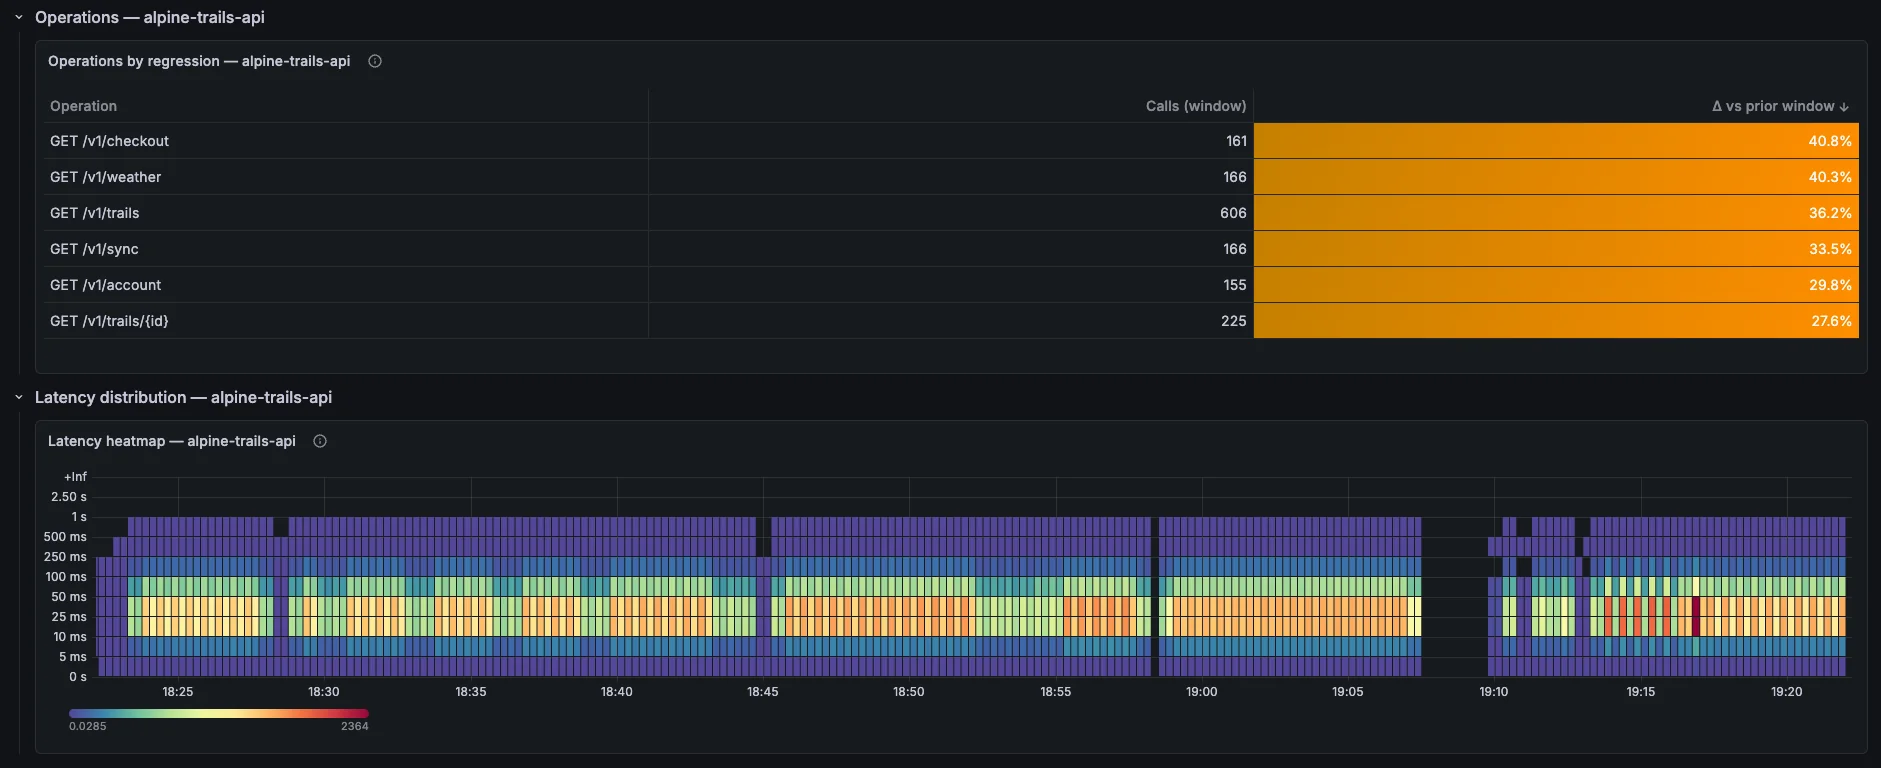
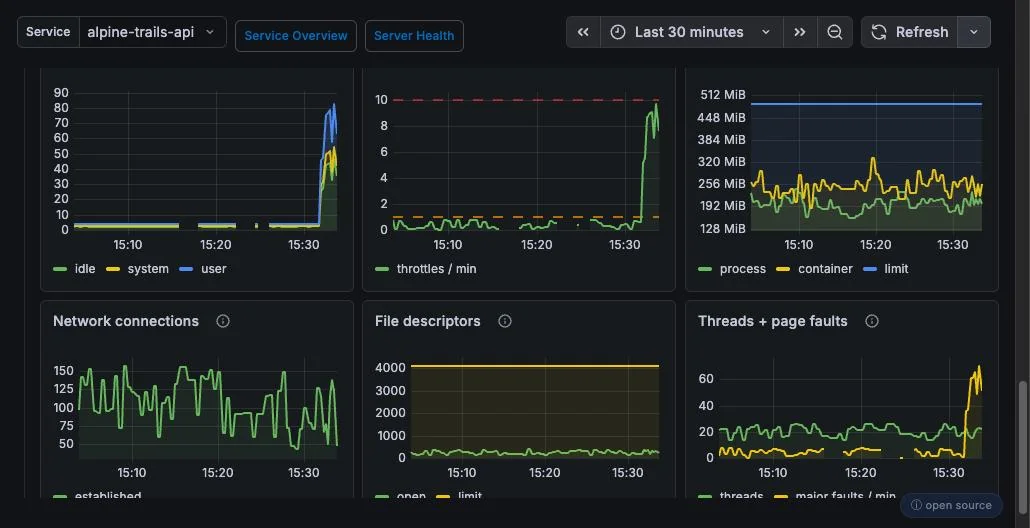
More dashboards, pre-loaded
No blank canvas: these ship with every Dartastic Observatory, Hosted or Cloud.
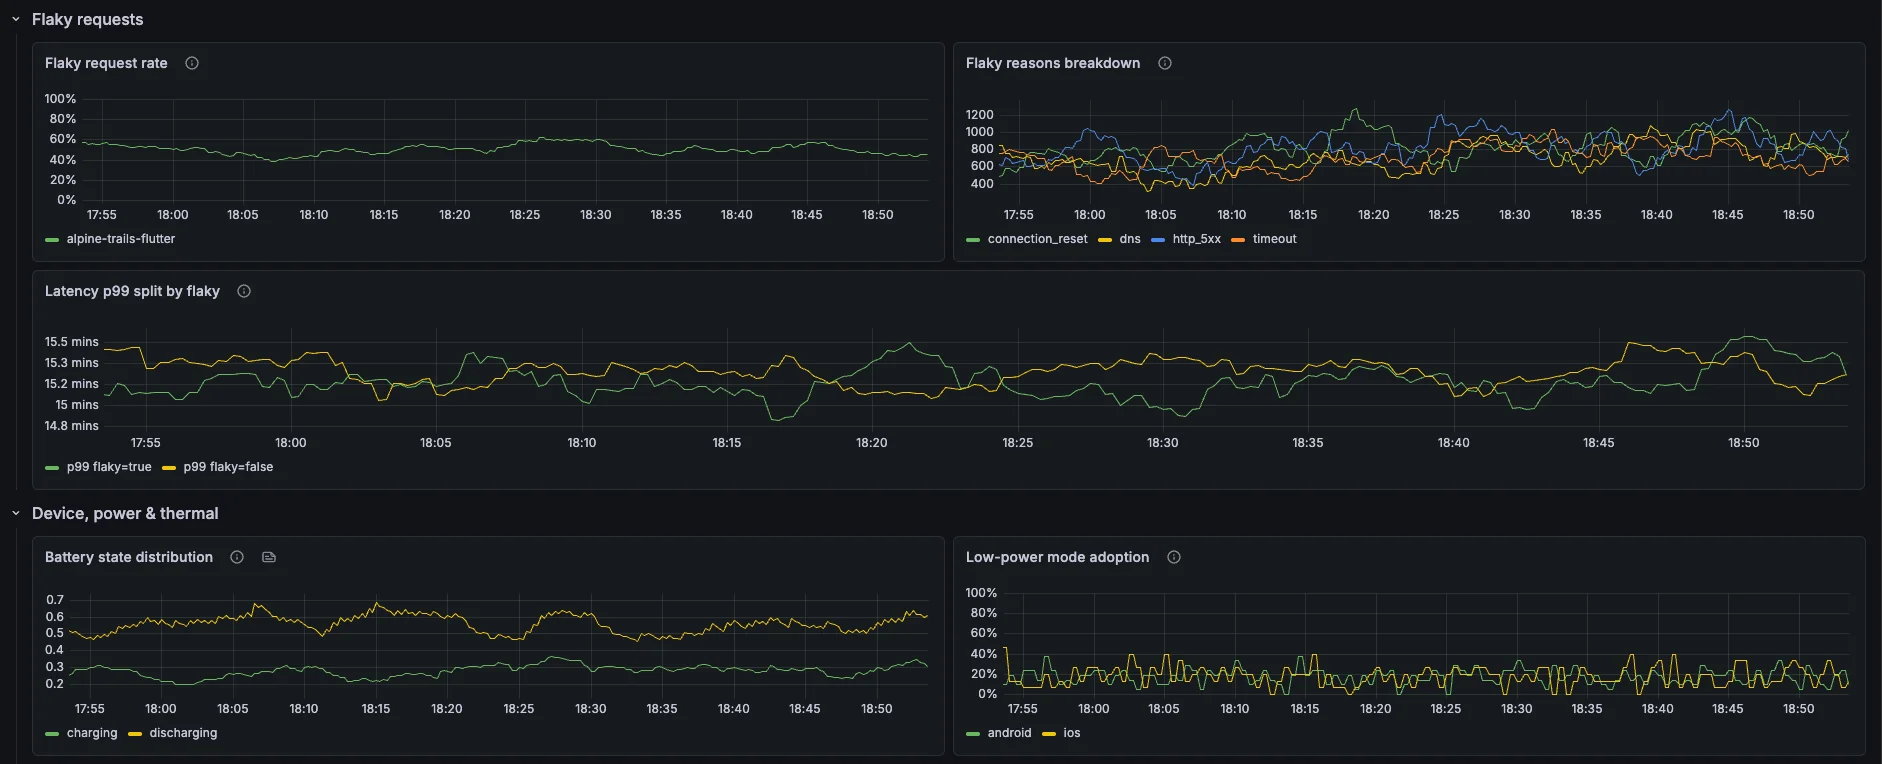
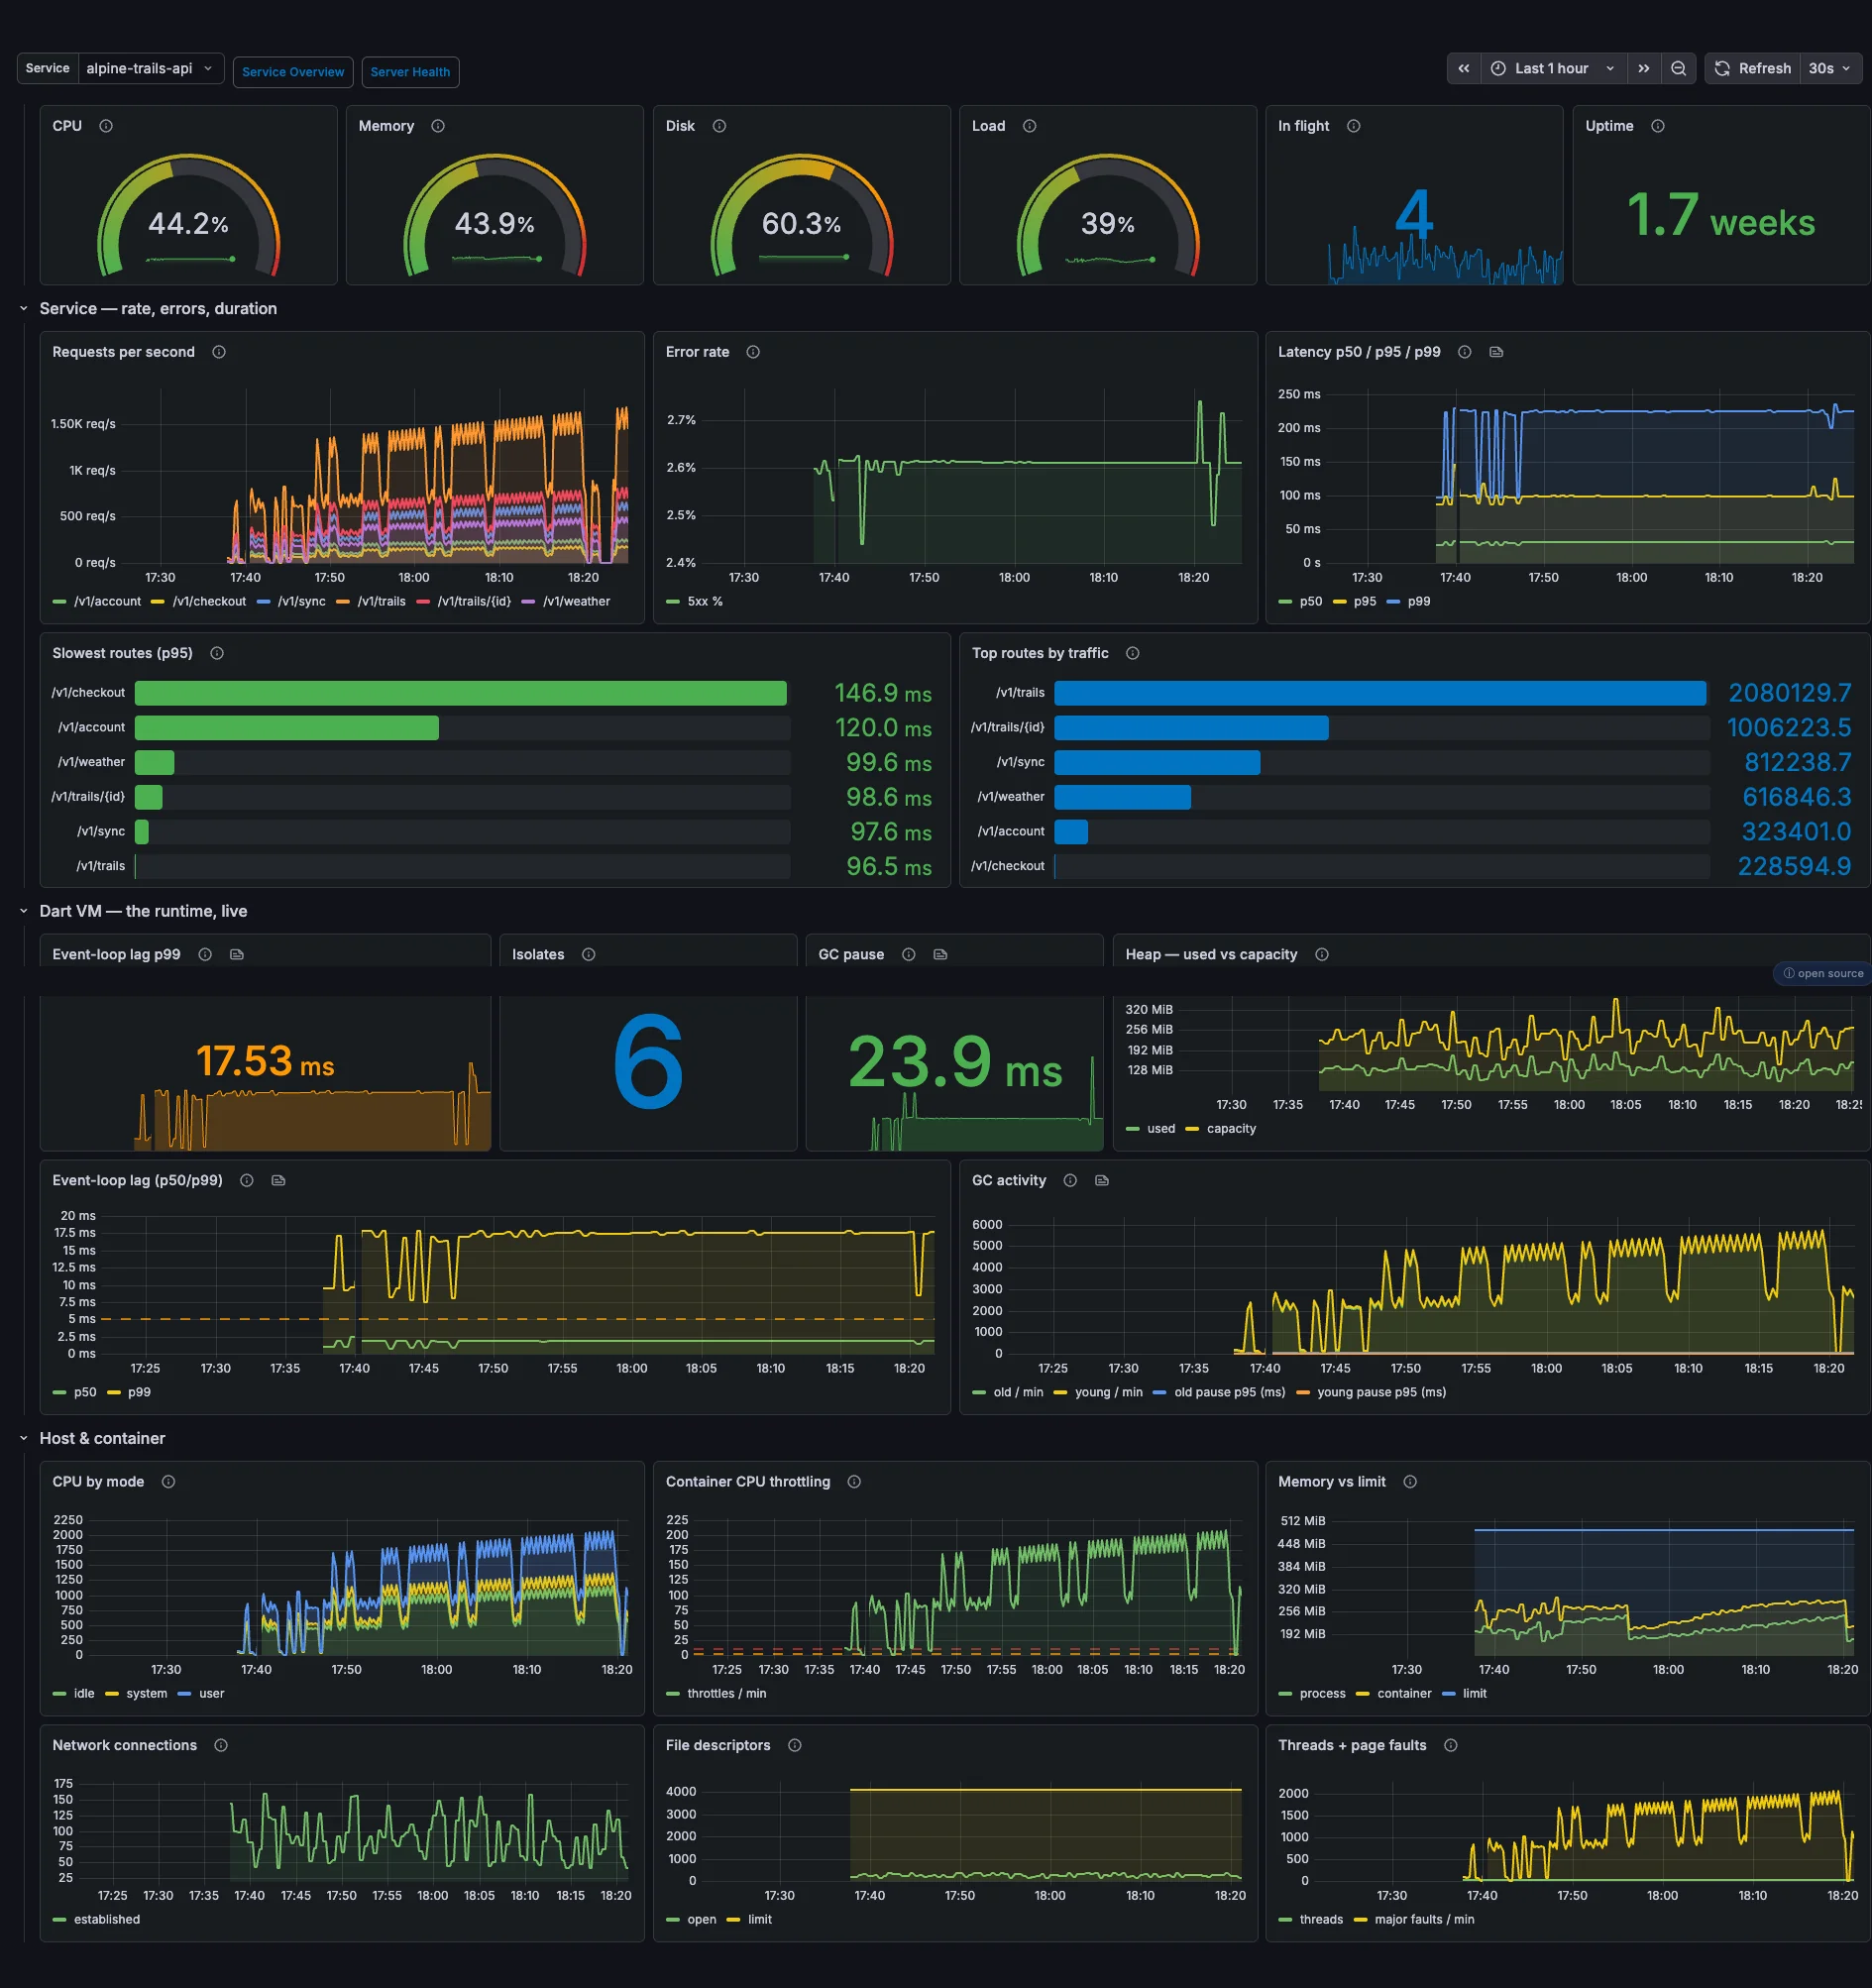
Point your exporter. That's the setup.
Any OpenTelemetry SDK in any language can send to your Dartastic Observatory: your Flutter app, your Dart backend, your Go services. Mint an ingest key, set three environment variables, and telemetry flows.
# Cloud:  otlp.cloud.dartastic.io       Hosted:  otlp.<your-slug>.dartastic.io
OTEL_EXPORTER_OTLP_ENDPOINT=https://otlp.cloud.dartastic.io:443
OTEL_EXPORTER_OTLP_PROTOCOL=grpc            # or: http/protobuf
OTEL_EXPORTER_OTLP_HEADERS="authorization=Bearer <otlp-ingest-key>"
Using the Dartastic Flutter SDKs? Add the package, call one start(), and the dashboards light up. No dashboard-building, no collector config.
Obfuscated frame to source line, where your data lives.
Production Flutter builds are obfuscated, so a crash reads like d.a.b(Unknown:0). The usual fix hands your debug symbols, the map to your source, to an observability vendor. Dartastic keeps them where you publish packages, in your private Dartastic Pub, with the Dartastic Symbolizer running right next to it. On Hosted that is your own box; on Cloud it is shared, hard-isolated infrastructure. Either way, click Get Source Lines and the frame resolves to the real file and line, with the trace that led to it.
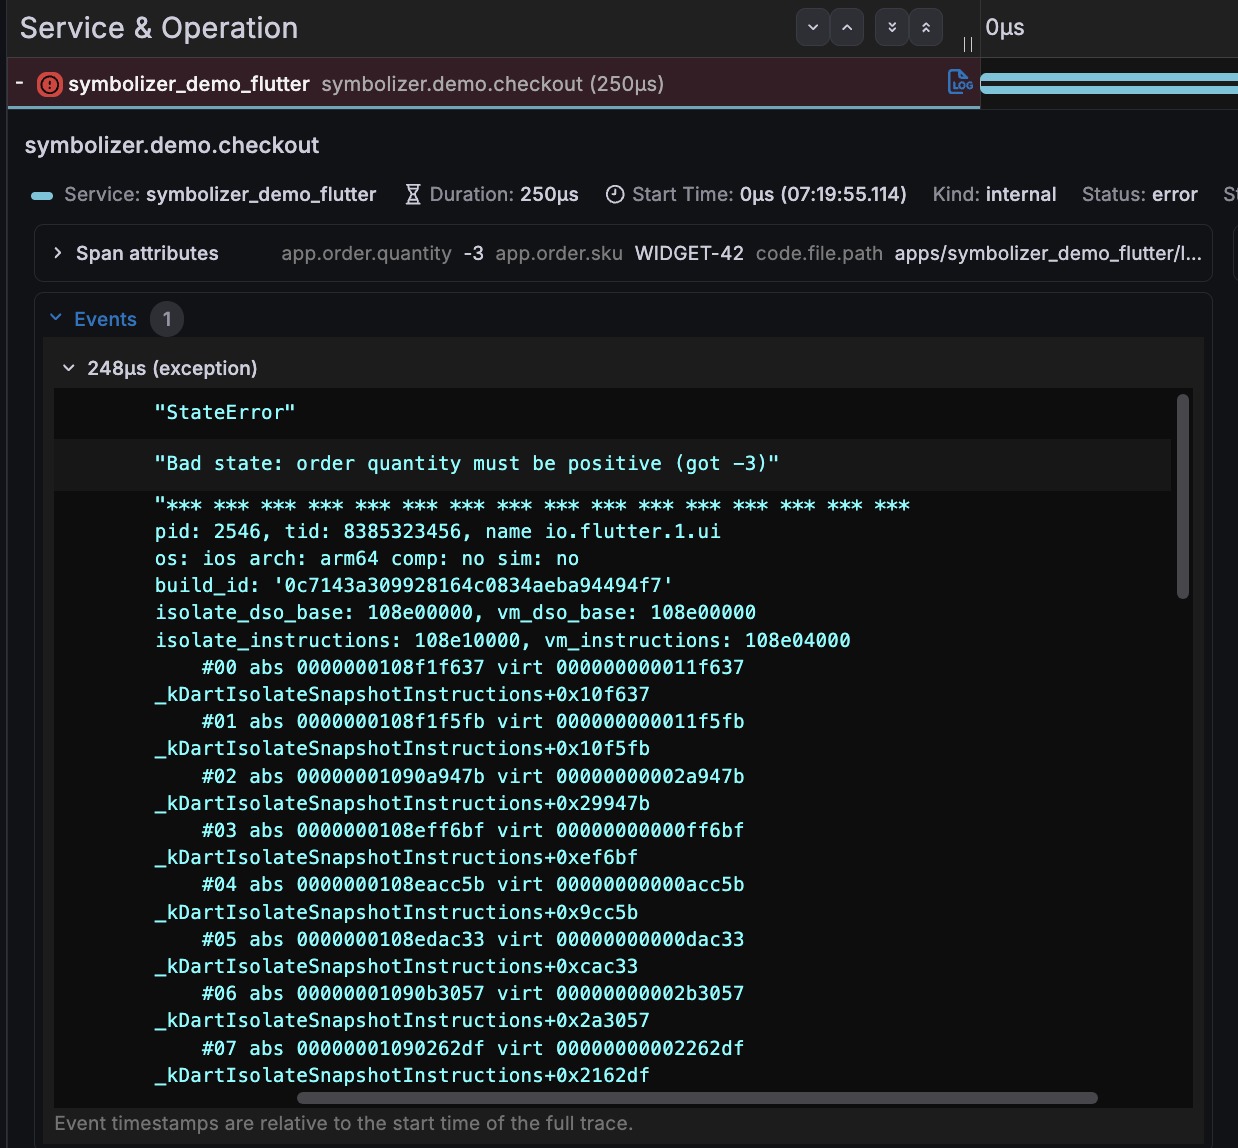
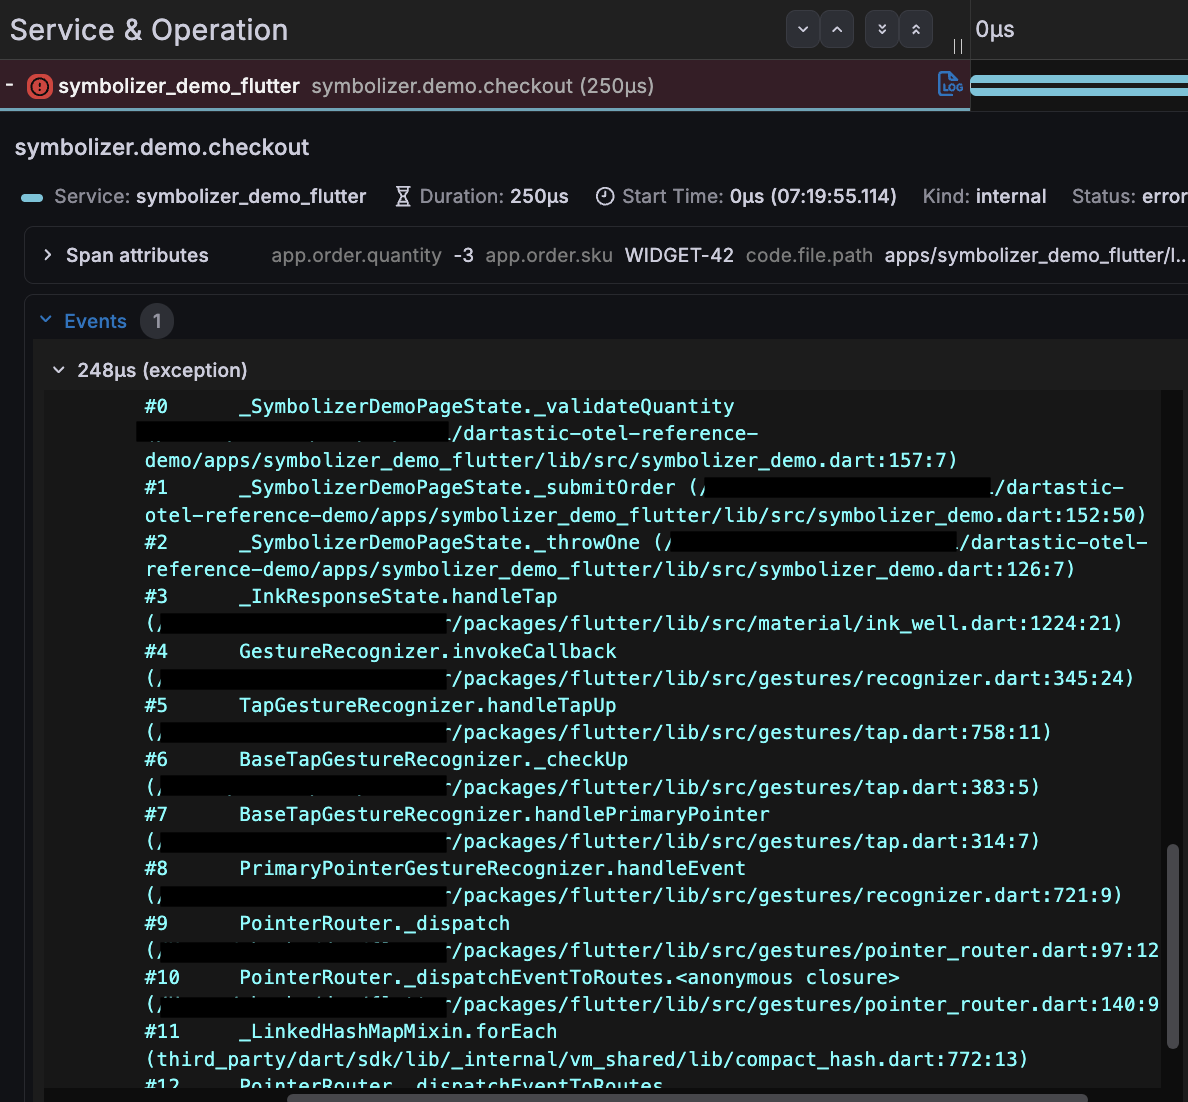
A private Dartastic Pub, included.
Every Dartastic Observatory subscription comes with a private package registry, so your team's Dart and Flutter packages live on the same infrastructure as your telemetry. On Hosted that is your own box; on Cloud it is shared, hard-isolated infrastructure.
- The pub.dev workflow you already know.
dart pub publish, versions, changelogs, search. - Fine-grained access control. Per-team and per-package, with fast revocation.
- Where your debug symbols live. The Dartastic Symbolizer reads them from Pub, so your source map never leaves your infrastructure.
- Daily backups, dual-region storage.
Using Sentry? Keep your DSN.
Point your existing Sentry.init DSN at your Dartastic Observatory and its events, transactions, and sessions are translated to OpenTelemetry on arrival. Move to native OTel screen by screen, on your own schedule.
See Dartastic Observatory subscription tiers on dartastic.io/pricing.