Dartastic Observatory Guide
Every pre-loaded dashboard, what each panel tells you, and the OpenTelemetry semantics behind it — for Cloud and Hosted.
One Dartastic Observatory, Two Ways to Run It
Dartastic Observatory is native OpenTelemetry observability for Dart and Flutter: dashboards, metrics, traces, and logs on proven open-source infrastructure, tuned for Flutter apps and Dart servers. It comes in two flavors, and every dashboard on this page ships pre-loaded in both:
- Dartastic Cloud (the default) — the shared, metered, start-fast tier at
cloud.dartastic.io. Subscribe, mint a token, send telemetry; usage is metered with one bill and prepaid packs. Plans & pricing. Includes Dartastic AI with a daily question limit. - Dartastic Hosted — a dedicated single-tenant stack behind
<subdomain>.dartastic.io: the same dashboards plus your private Dartastic Pub and private Dartastic Symbolizer, and your data never shares a machine with another customer. Four tiers: Mini ($299), Business ($699), Enterprise ($1799) and Enterprise Plus ($5499); compare on Pricing.
The end-to-end onboarding journey is covered in Getting started. Hosted stacks provision in 5–15 minutes; the Hosted page flips from "brewing" to your live URLs, with copy buttons. Cloud access is immediate on the Cloud tab.
Hosted autoscale & bill cap
Hosted stacks vertical-resize during sustained traffic spikes (resize-up only, never down) so launches don't drop telemetry. It's on by default; switch it off — or set a monthly bill cap — on the Hosted page if billing predictability matters more. A resize that would pass your cap sends an "upgrade?" email instead of resizing.
Enterprise ships with white-glove provisioning — a dedicated contact, custom dashboards on request, per-region deploy (NA / EU / APAC). Your stack is a person, not a ticket.
Send Telemetry to Your Dartastic Observatory
Mint an Dartastic Observatory OTLP token on the Tokens page, then point any OpenTelemetry SDK or collector at your authenticated OTLP endpoint:
OTEL_EXPORTER_OTLP_ENDPOINT=https://otlp.cloud.dartastic.io:443
OTEL_EXPORTER_OTLP_HEADERS="authorization=Bearer <your Dartastic Observatory OTLP token>"
# optional — http/protobuf is the default:
OTEL_EXPORTER_OTLP_PROTOCOL=http/protobuf The same endpoint works from the Dartastic SDK's endpoint: parameter, a collector, or any other OTLP-speaking service — your whole backend can report into the same Dartastic Observatory as your Flutter apps. Include the :443; some OTLP clients guess the port wrong without it. Setup for the SDK itself is under OTel SDK.
When a Hosted Stack Ends
Cancel at the end of your billing period: your stack keeps running until the period ends, then winds down over several weeks (read-only, then suspended) before it is destroyed, so there is time to export what you need.
Ending it now (cancel with Destroy my stack now, switching from Hosted to a library plan, or deleting your account): a stack that has run 45 days or more becomes read-only for 30 days so you can export, then is destroyed. A newer stack, such as one you only tried out, is destroyed right away.
When a stack is destroyed, its access credentials stop working at once and its package storage and backups are permanently deleted 30 days later.
Reading the Dashboards
Every pre-loaded dashboard follows the same conventions:
- Pickers at the top. Service, Environment, and (on mobile dashboards) App Build filter everything below; they default to All. The build picker is how you compare releases — nearly every mobile panel can be split by
app.build_id. - Short titles, rich tooltips. Panel titles stay short enough to survive narrow layouts; hover the on a panel for the full description of what it shows and the telemetry it reads.
- Percentiles over averages. Latency panels show p50/p95/p99 — averages hide the users having a bad time.
- Thresholds mean something. Green/amber/red bands follow the platform vitals thresholds (frozen frames, ANR rates, crash-free floors), not arbitrary cutoffs.
- Drill down, don't squint. The ladder is fleet → dashboard → panel → traces: most panels link through to trace search filtered to the same service, build, and time range, so a spike is two clicks from the spans that caused it.
Metric names change in the next engine release
The keys listed under each dashboard below are what your engine emits today. A coming release of dartastic_semantics (2.5.6) renames thirty-three instruments. There is no dual-emit: a renamed metric stops arriving under its old name the moment you ship the new engine, so panels and any alerts you built yourself move at the same time. Dartastic's own dashboards are updated in step.
Two reasons for the renames. Most move out of registry-owned namespaces — device.*, app.*, system.*, process.*, container.*, network.* — and into dartastic.*, because OpenTelemetry either does not define them or defines them as a different instrument type or with a different meaning. Where the registry does fit, we keep the registry's own name: app.build_id, app.screen.name, session.id and error.type are not changing. A few others drop a unit or a _total suffix that the instrument already declares.
| Today | From 2.5.6 |
|---|---|
device.battery.level | dartastic.battery.level |
device.battery.state | dartastic.battery.state |
device.battery.low_power_mode | dartastic.battery.low_power_mode |
device.thermal_state | dartastic.thermal.state |
device.thermal_state.event | dartastic.thermal.state.event |
app.runtime.seconds | dartastic.app.runtime |
network.bytes | dartastic.network.io |
process.disk.io.logical.write.bytes | dartastic.process.disk.io.logical.write |
flutter.anr.events_total | flutter.anr.events |
flutter.frame.dropped_total | flutter.frame.dropped |
Twenty-eight further instruments take a straight dartastic. prefix on their existing name. This table lists the ones whose spelling changes by more than the prefix, plus every key named on the dashboards below.
Mobile Performance Summary
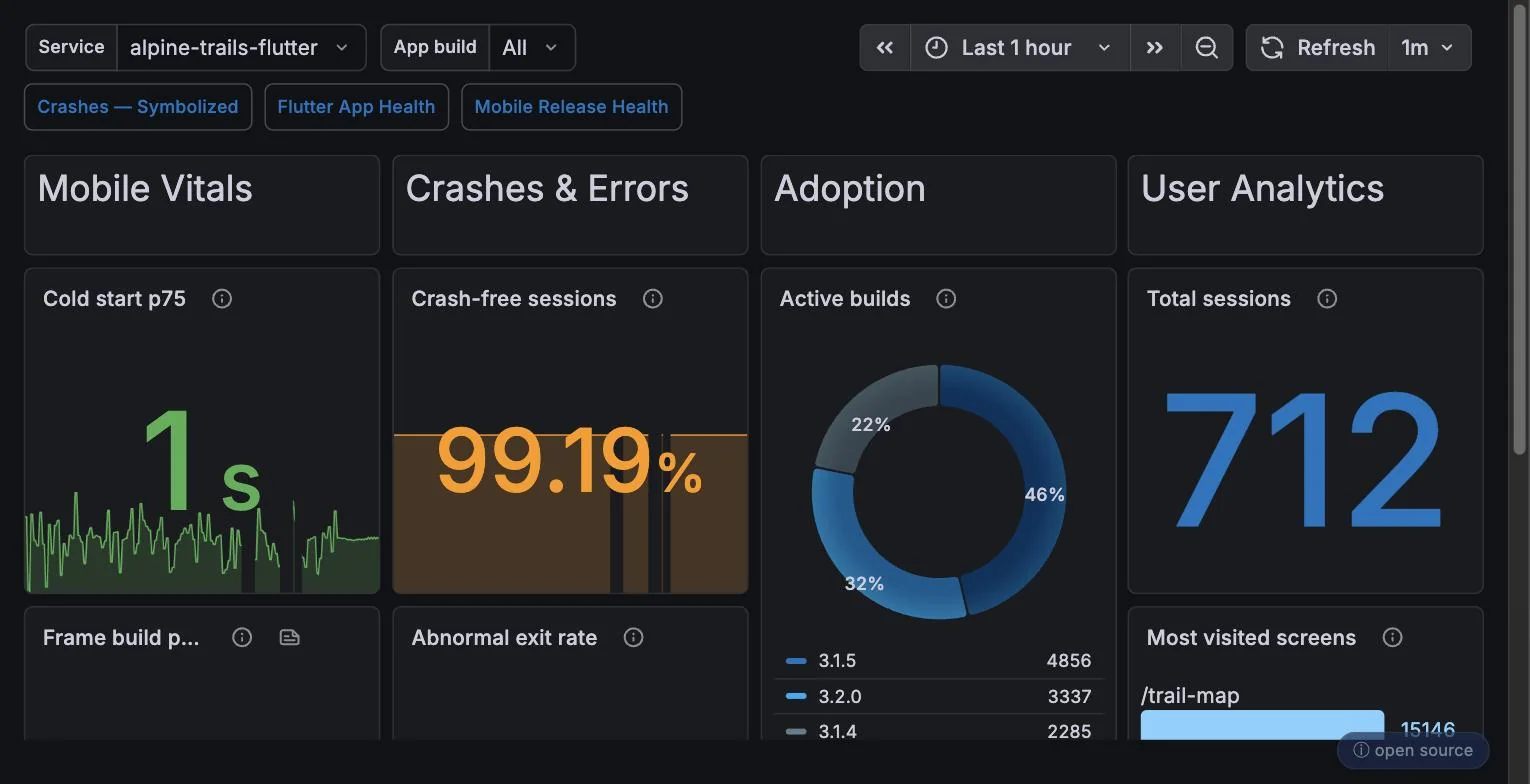
The fleet home page — one screen that answers "how is the app doing in production right now?" Start here every morning; every other mobile dashboard is a drill-down from it.
Sections
- Vitals scorecard — the numbers app stores and leadership ask for: crash-free sessions %, ANR rate, cold and warm app-start p75, slow-frame and frozen-frame rates. Each gauge carries its platform threshold, so amber/red is meaningful, not decorative.
- Frustration signals — taps that coincided with an error: a tap that raised an error during handling, or was followed by one within ~100 ms. It surfaces "users are hammering a broken button" long before reviews do, with the screens where it happens.
- Crashes & errors — crash and error-session trends with the top exception types, linking into the Crashes dashboard for symbolized stacks.
- Adoption & usage — sessions, distinct users, and version spread, so you can see a rollout take traffic while its vitals move (or don't).
- Per-screen breakdowns — the same vitals cut by
app.screen.name: which screens jank, which crash, which frustrate.
Telemetry it reads
| Key | Kind | On this dashboard |
|---|---|---|
flutter.session.count | Dartastic | Session outcomes: the crash-free numerator and denominator, totals, and sessions per build. |
flutter.app.startup.duration_ms | Dartastic | Cold-start p75 (filtered to app.start.type = cold). |
flutter.frame.build_ms | Dartastic | Frame build-time p95. |
flutter.navigation.duration_ms | Dartastic | Most-visited screens, from navigation counts per screen. |
flutter.anr.events_total | Dartastic | Top screens by ANR events. |
app.exit.count | Dartastic | Abnormal-exit rate (reason != normal). |
process.memory.usage | OTel | Average resident memory. |
service.name | OTel | The Service picker; on every query. |
app.build_id | OTel | The App Build picker and every per-release split. |
app.screen.name | OTel | Per-screen ANR and most-visited breakdowns. |
session.status | Dartastic | started | ok | errored | crashed | abnormal — the outcome filters. |
app.start.type | Dartastic | cold | warm | hot | prewarmed — the cold-start filter. |
app.exit.reason | Dartastic | Exit reason: normal | memory_pressure | anr | oom | watchdog | bad_access | cpu_limit. |
Crashes — Symbolized, Next to the Exception
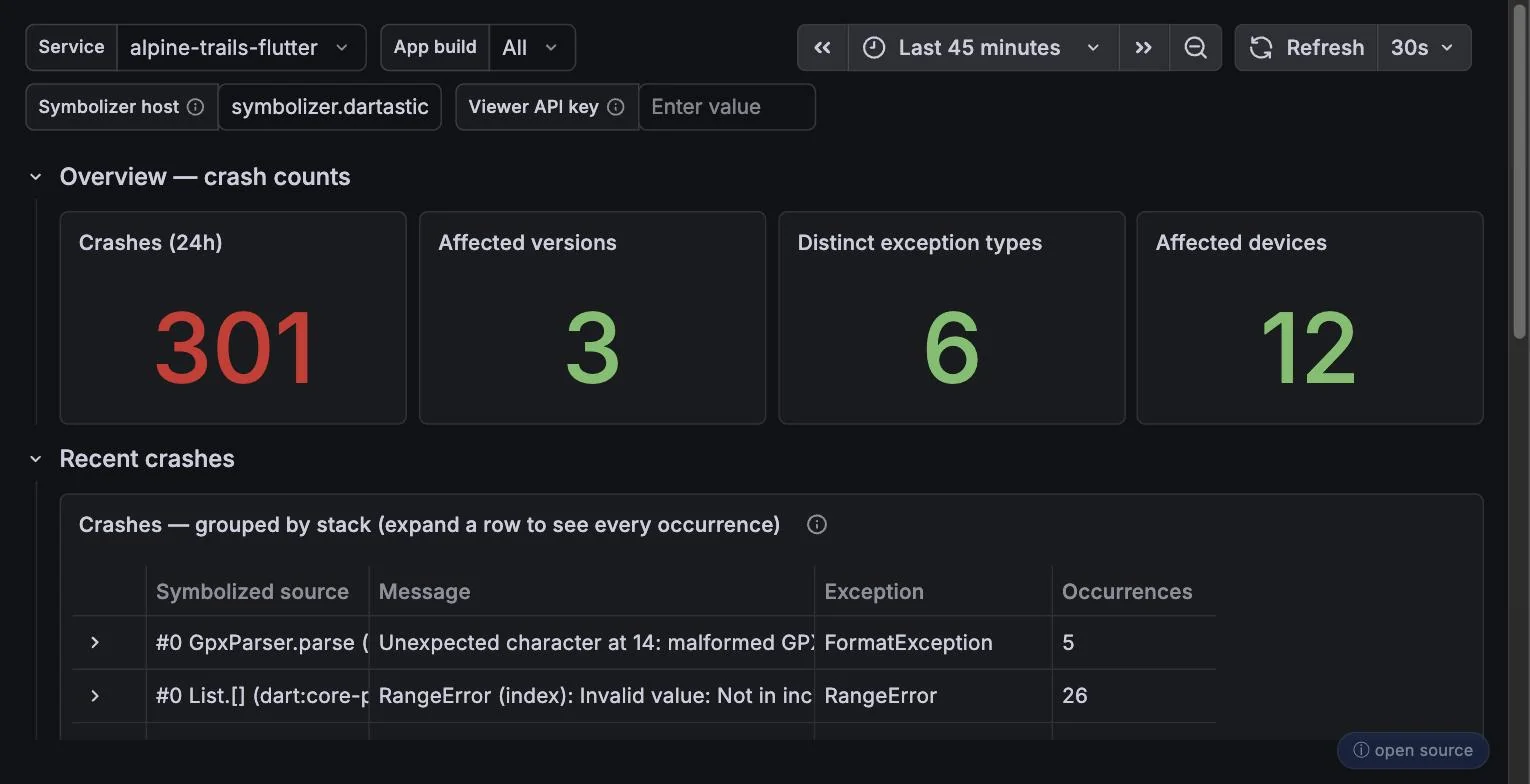
Everything about crashes and unhandled errors, with the Dartastic Symbolizer's deobfuscated stack sitting directly beside the raw one — no separate crash portal, no copy-pasting stacks into a decoder.
Sections
- Crash counts & crash-free trend — crashes and crash-free sessions % over time. The crash-free line is the release gate: it should recover to baseline within hours of a rollout, and this panel is where you watch it do so.
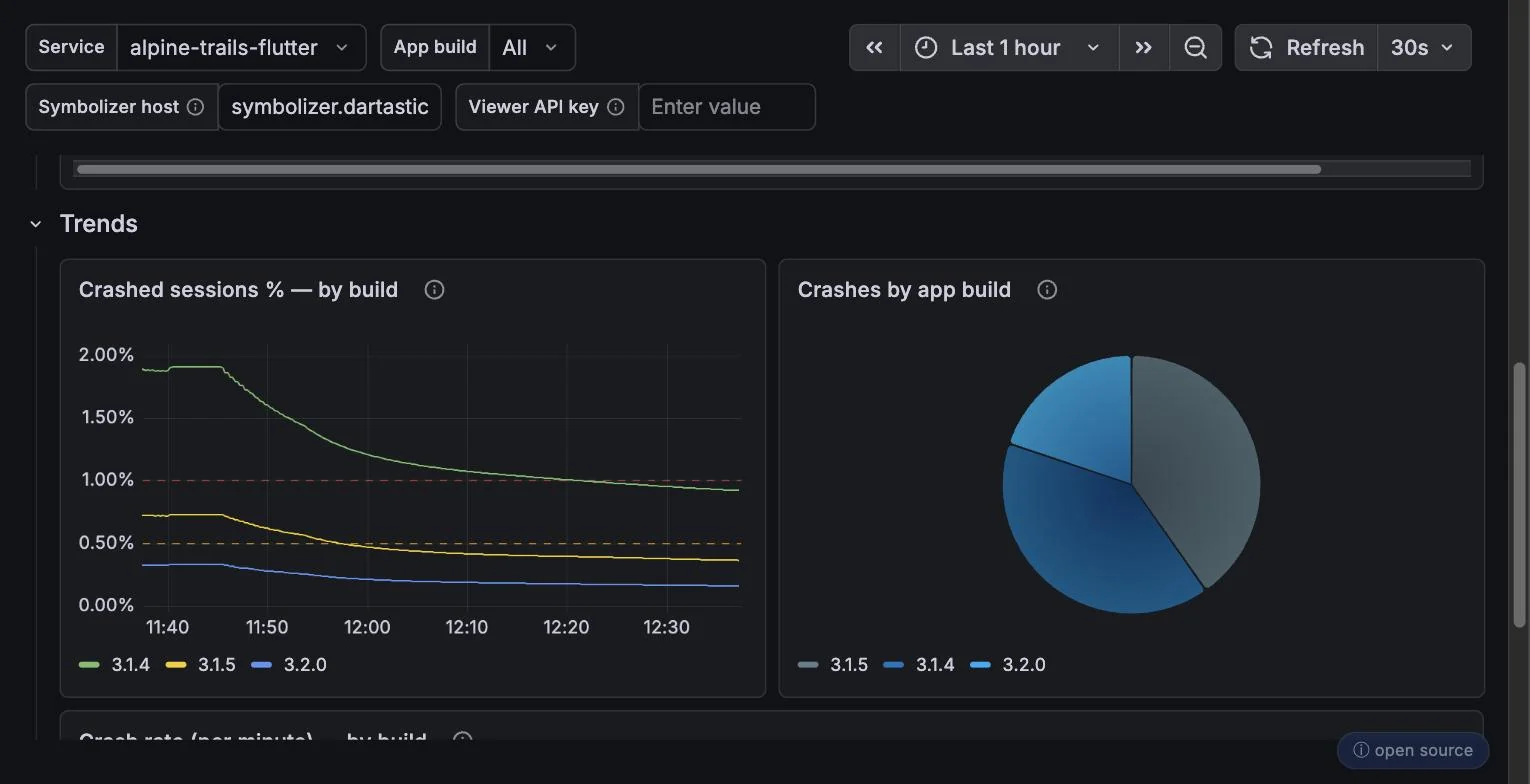
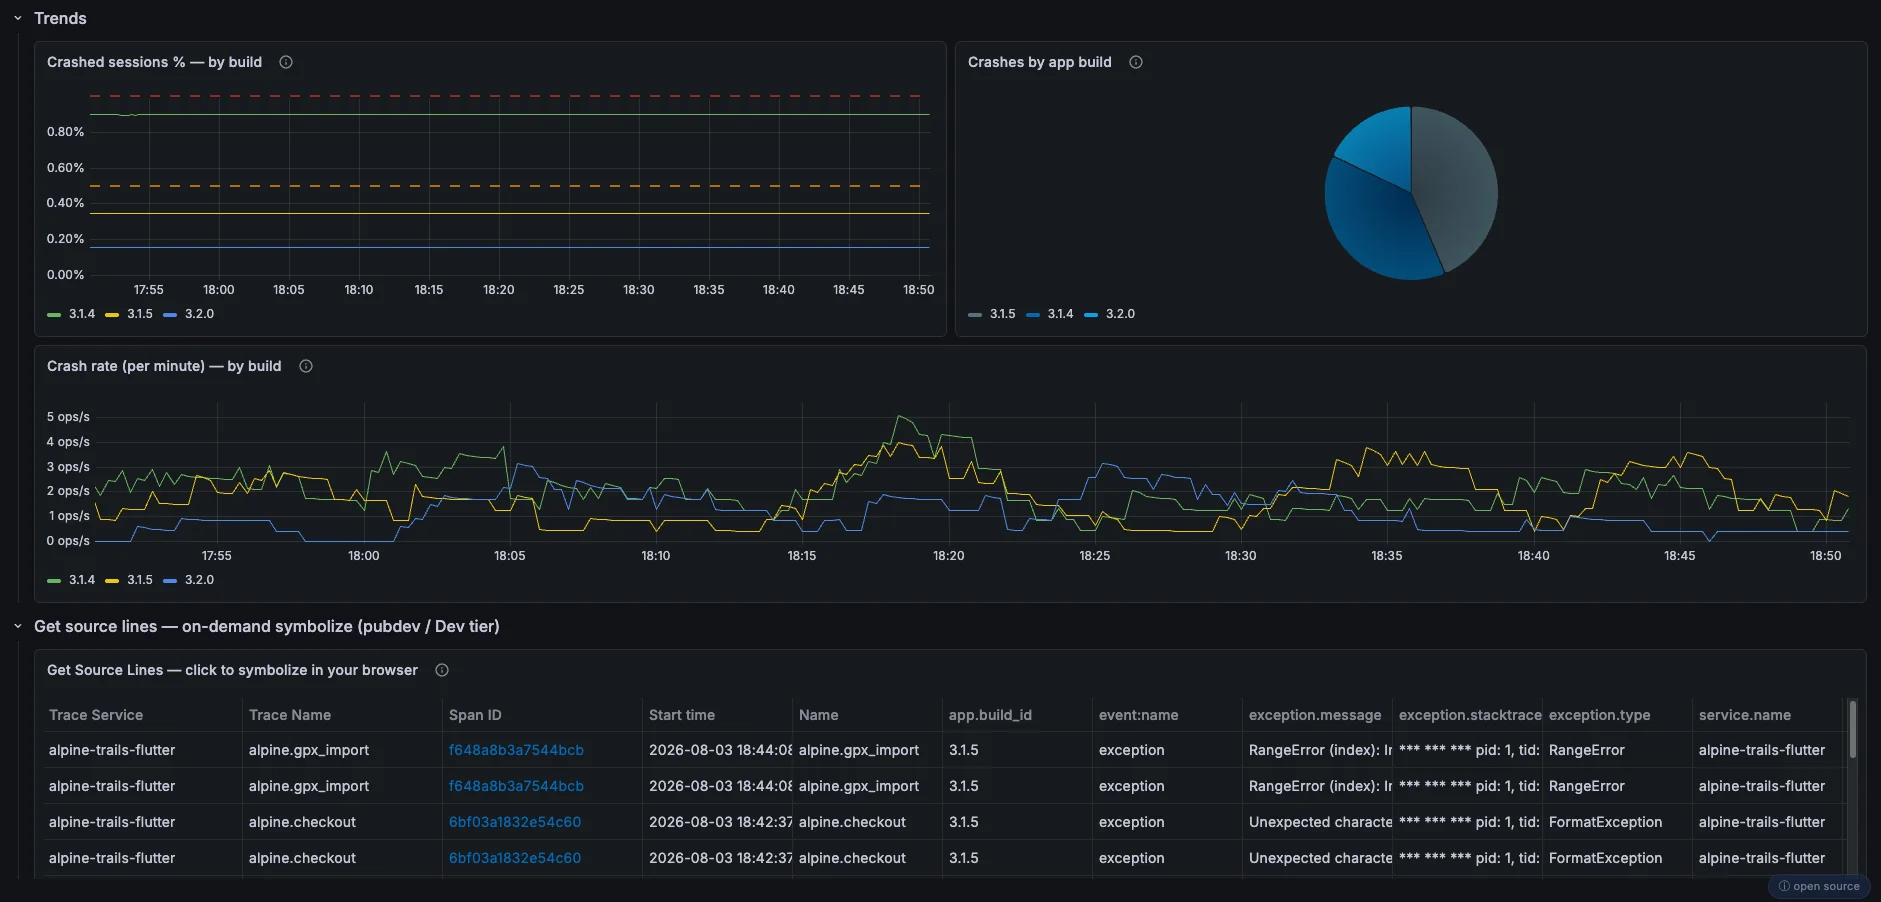
- Trends by build — the same series split by
app.build_id, so a regression shows up as one build's line peeling away from the pack. - Top crash groups — a table grouped by exception type: count, trend, affected builds and devices. Sort by count for triage, by "first seen in build" for release-blame.
- Device & platform split — crashes by
device.model.identifierand OS: the panel that separates "our bug" from "that one Android vendor's bug." - Crash detail — click through to the error span: the standard
exception.type/exception.message/exception.stacktrace, withdartastic.exception.stacktrace.symbolizedright next to it holding readable Dart frames.
Telemetry it reads
| Key | Kind | On this dashboard |
|---|---|---|
traces_spanmetrics_calls_total | Derived | Crash counts from error spans, generated at ingest from your traces. |
status_code | Derived | Filters the derived counts to error-status spans. |
flutter.session.count | Dartastic | Crash-free % and crashed-sessions-by-build trends. |
session.status | Dartastic | crashed | abnormal vs all outcomes in the crash-free math. |
service.name | OTel | Service picker, trace filters, and the app identity on the symbolizer link. |
app.build_id | OTel | Build picker, per-build splits, affected-build counts, and the symbolizer link version. |
device.model.identifier | OTel | Affected-device counts and the Device column. |
dartastic.exception.type | Dartastic | Distinct-exception-type counts (crash-metric dimension). |
exception.type | OTel | Exception column and crash-group key. |
exception.message | OTel | Message column and crash-group key. |
exception.stacktrace | OTel | The raw (often obfuscated) stack; input to the symbolizer. |
dartastic.symbolize.status | Dartastic | Symbolized? column: ok | symbols_not_published | error. |
dartastic.exception.stacktrace.symbolized | Dartastic | The readable, deobfuscated stack shown beside the raw one. |
Flutter App Health
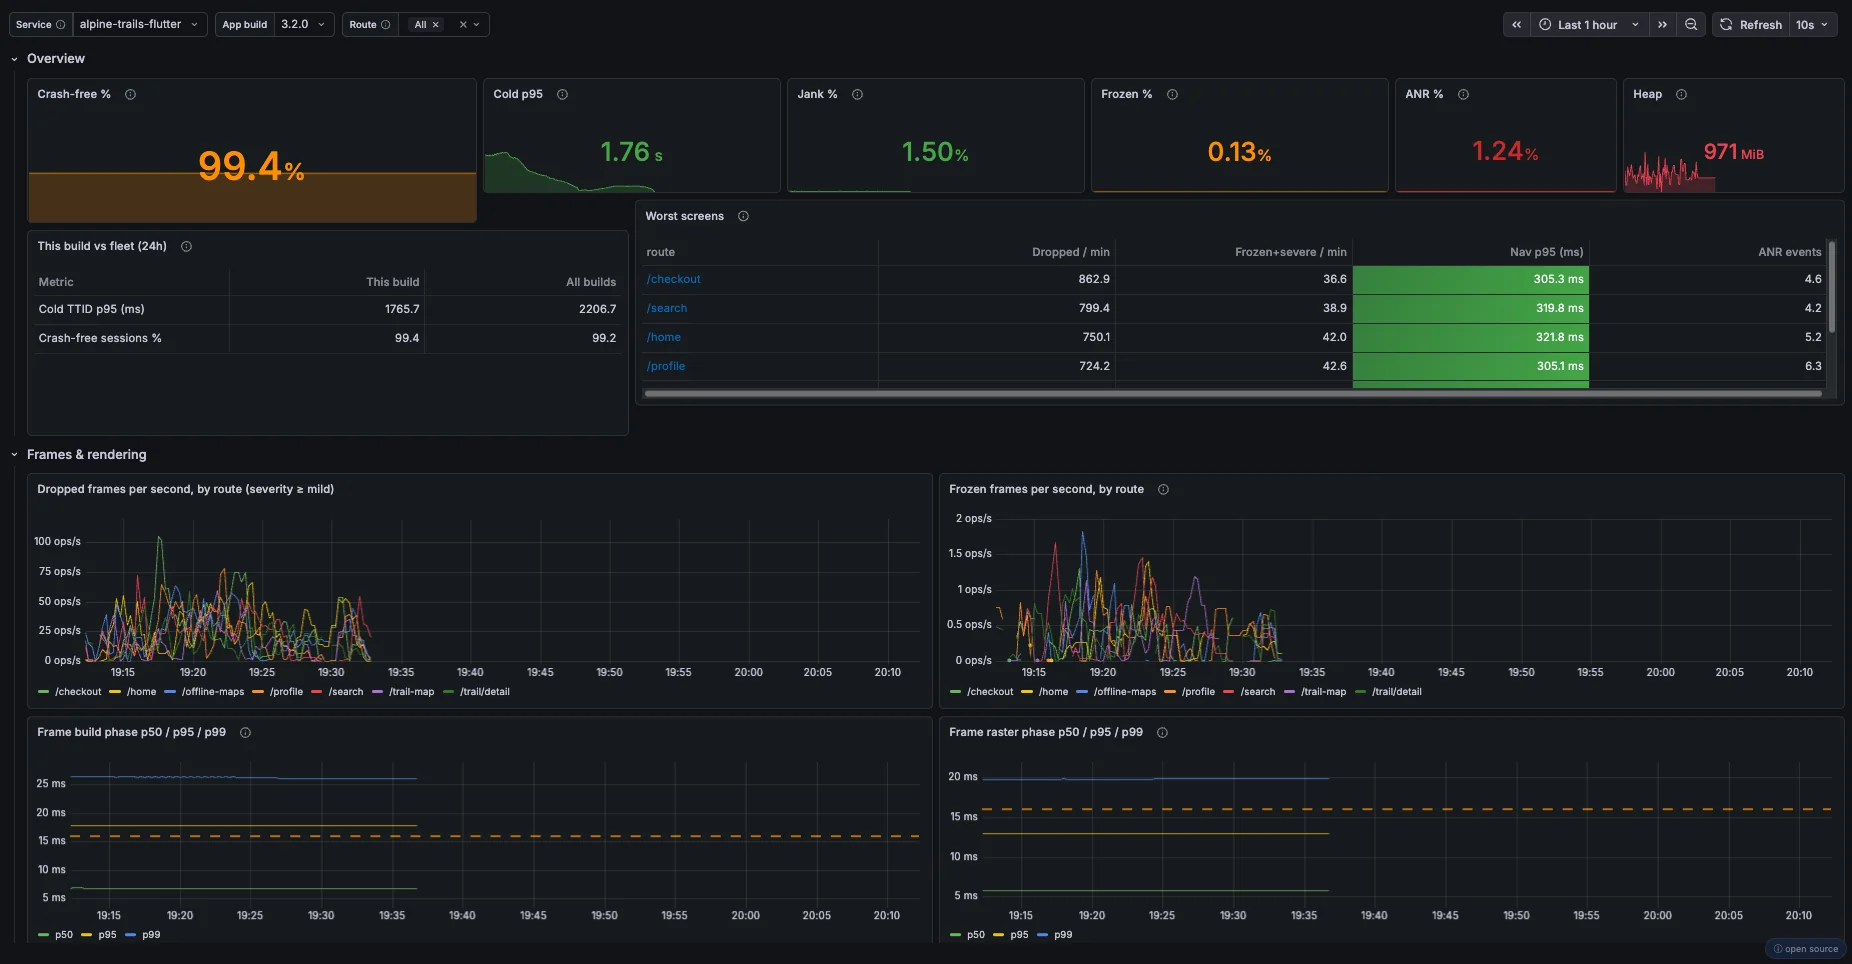
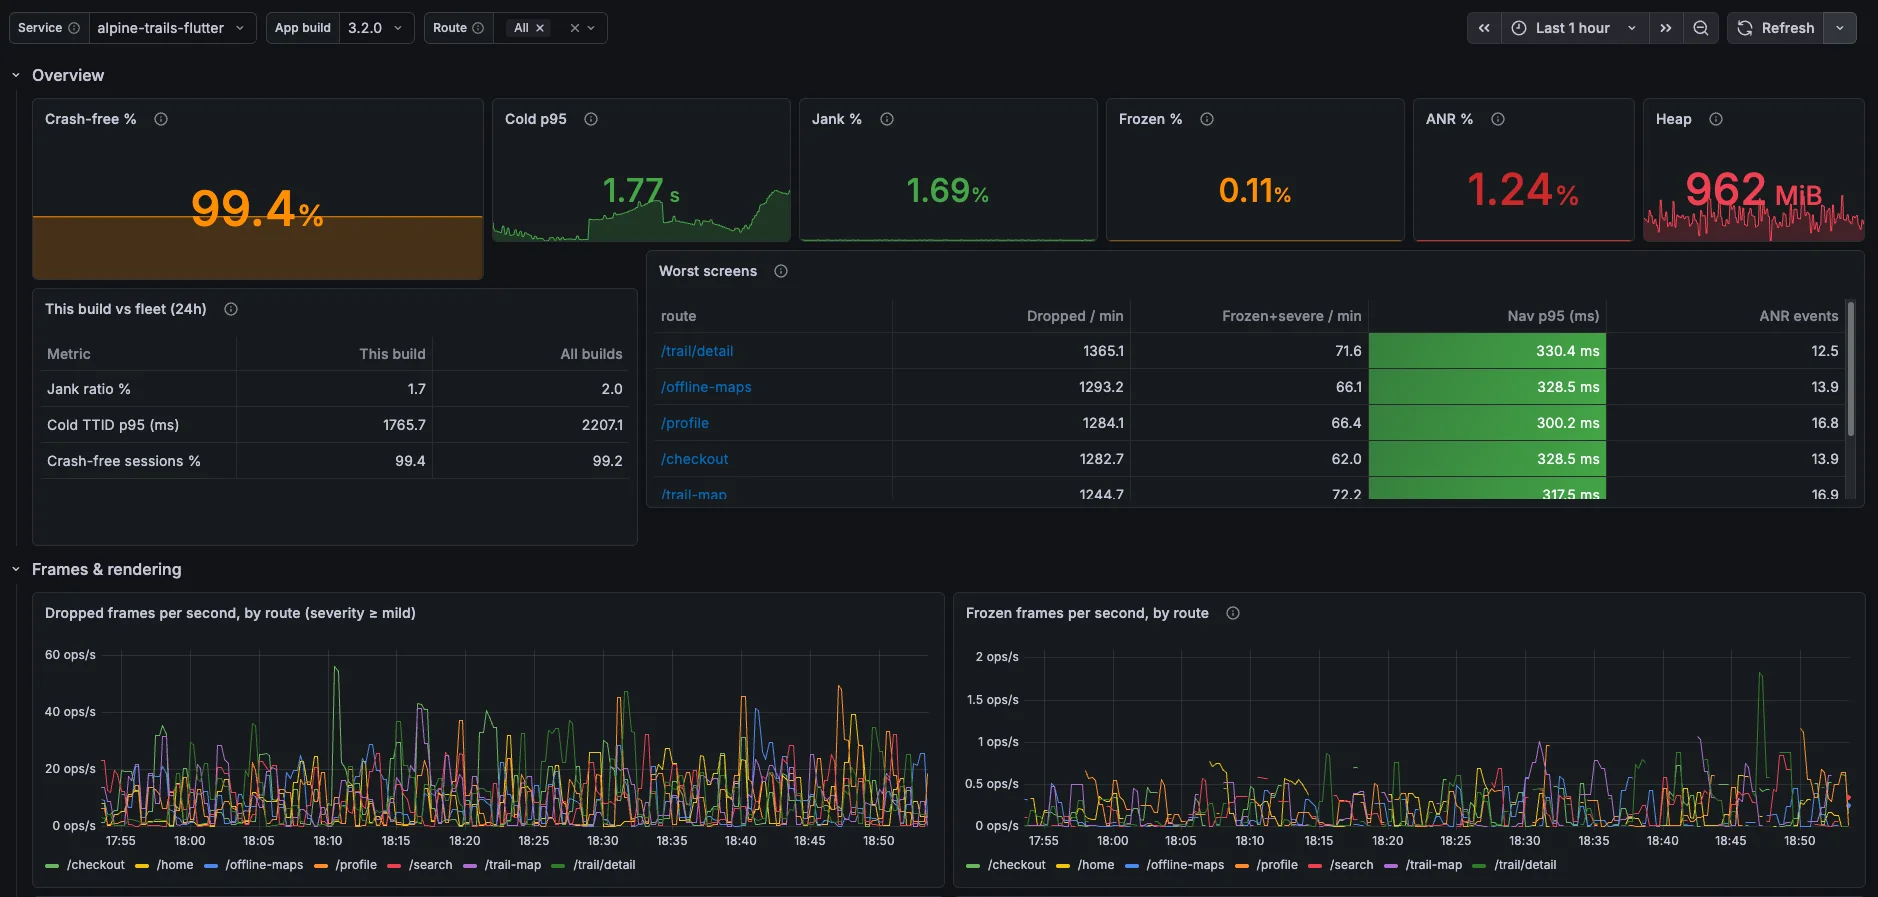
The deep-dive on how the app feels: frames, jank and its attribution, ANRs, memory, user-experience vitals, network flakiness, and device state. Where the Performance Summary says "frames regressed," App Health says which screen, which widget, on which devices, and why.
Sections
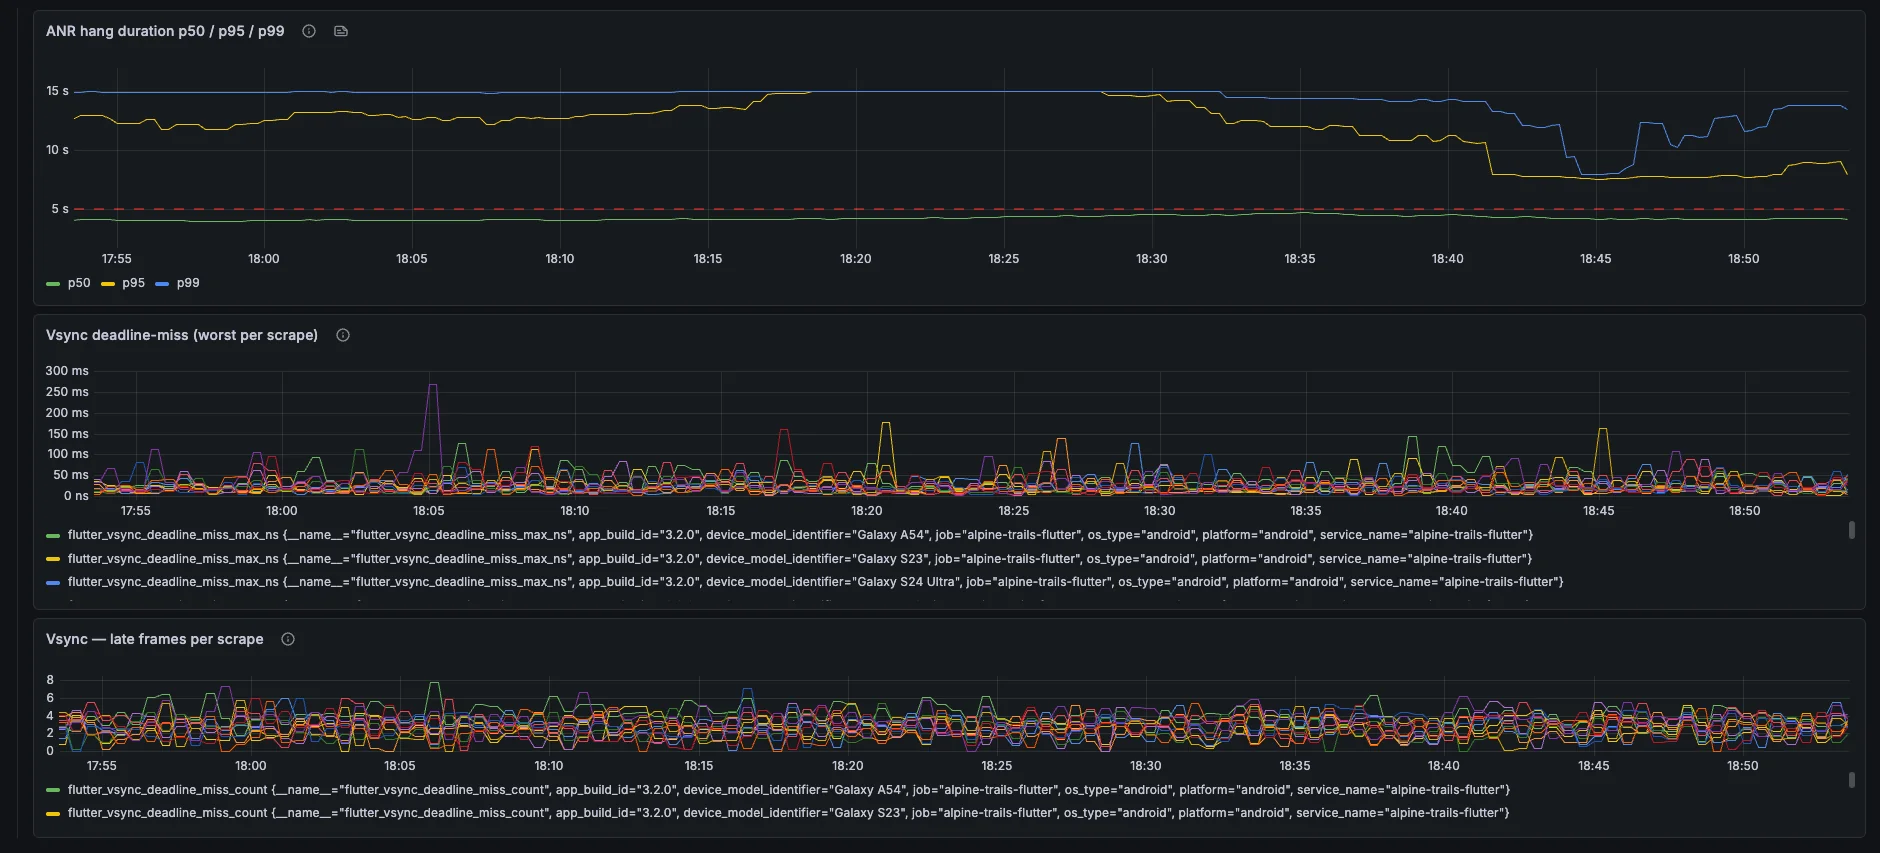
- Frame health — build and raster time percentiles against the vsync budget, the severity mix (mild · slow · severe · frozen), and vsync-overrun depth (
dartastic.frame.overrun): not just how many frames missed, but by how much. - Worst screens & jank attribution — screens ranked by jank, and for armed devices the Dartastic Native OTel Pro's attribution: the widgets and functions actually on the UI thread during janky frames (
dartastic.jank.attribution.*, withsymbols_resolvedmarking deobfuscated samples). This is the panel that turns "the app stutters" into a file and line. - ANR — App-Not-Responding events by severity (info · mild · severe) and by screen, from the engine's watchdog. Severe ANRs are what app stores punish; the info-tier ones are your early warning.
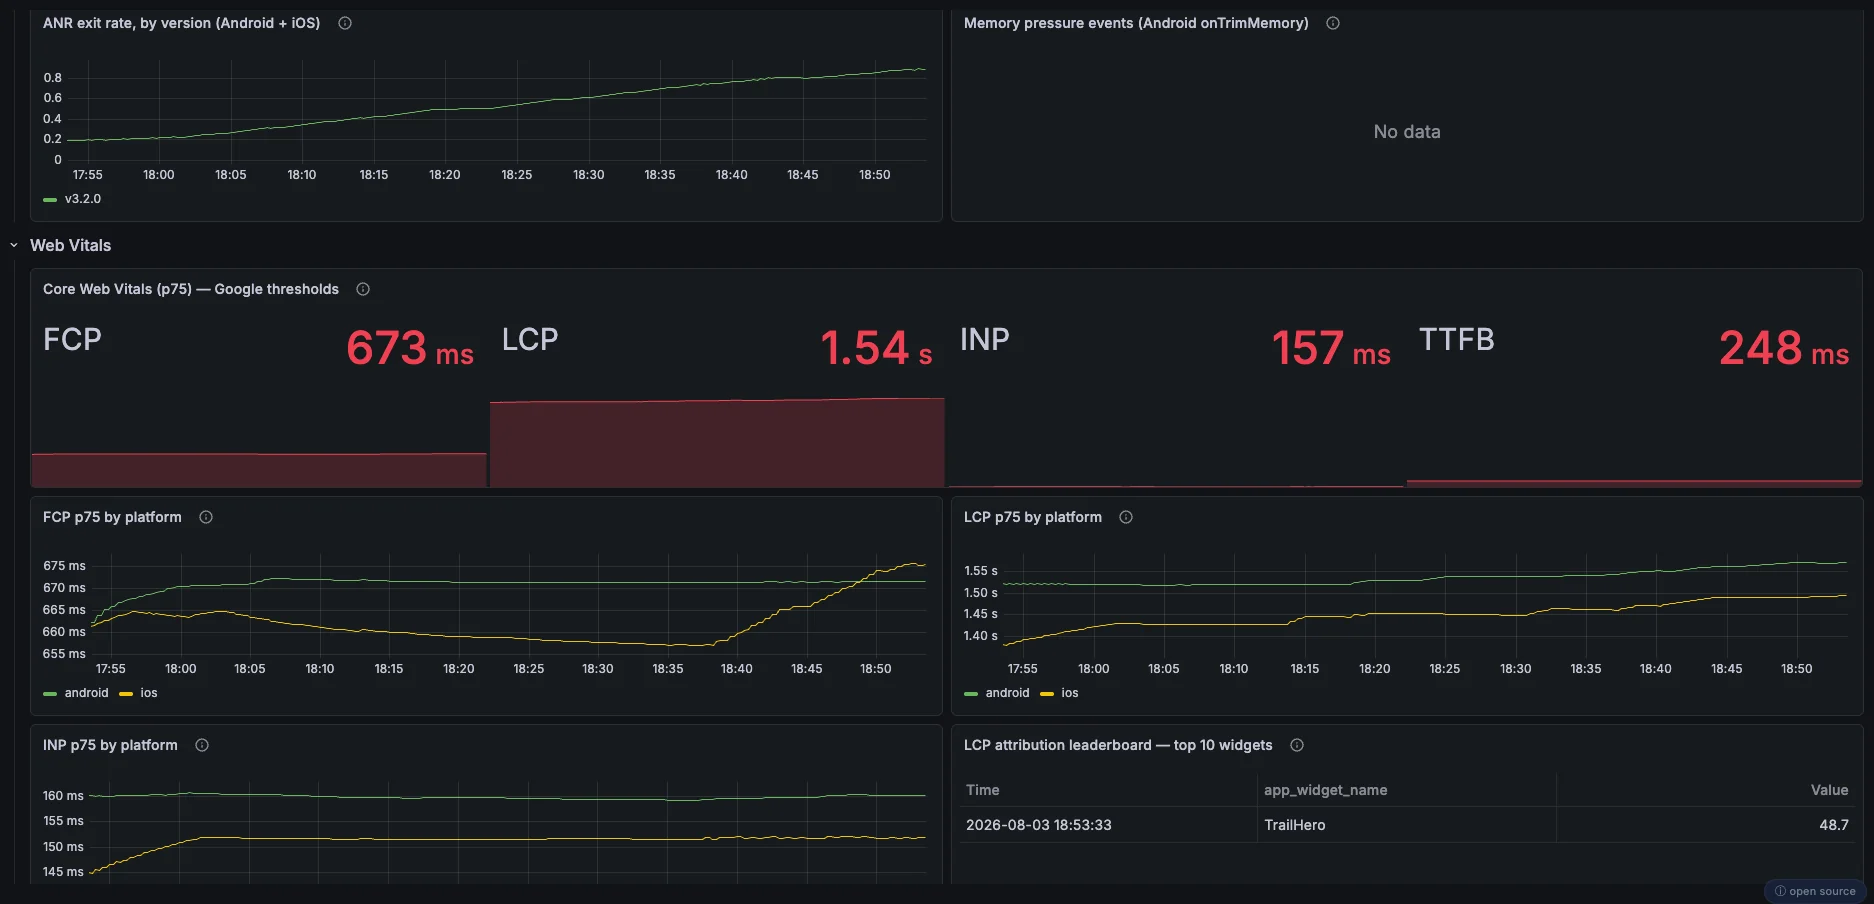
- Memory — Dart heap used vs capacity, native (non-Dart) heap allocation, and OS memory-pressure events (Android
onTrimMemorylevels, iOS warnings). Climbing native heap with stable Dart heap is the classic plugin-leak signature, and it's visible here. - User-experience vitals — web-vitals-style measures for Flutter: first and largest content paint, interaction latency, time to first byte on app-critical requests.
- Network flakiness, power & thermal — the share of HTTP spans tagged flaky (with reasons: timeouts, resets, DNS), battery drain, and thermal state. When frames regress only on hot or low-battery devices, this row says so.
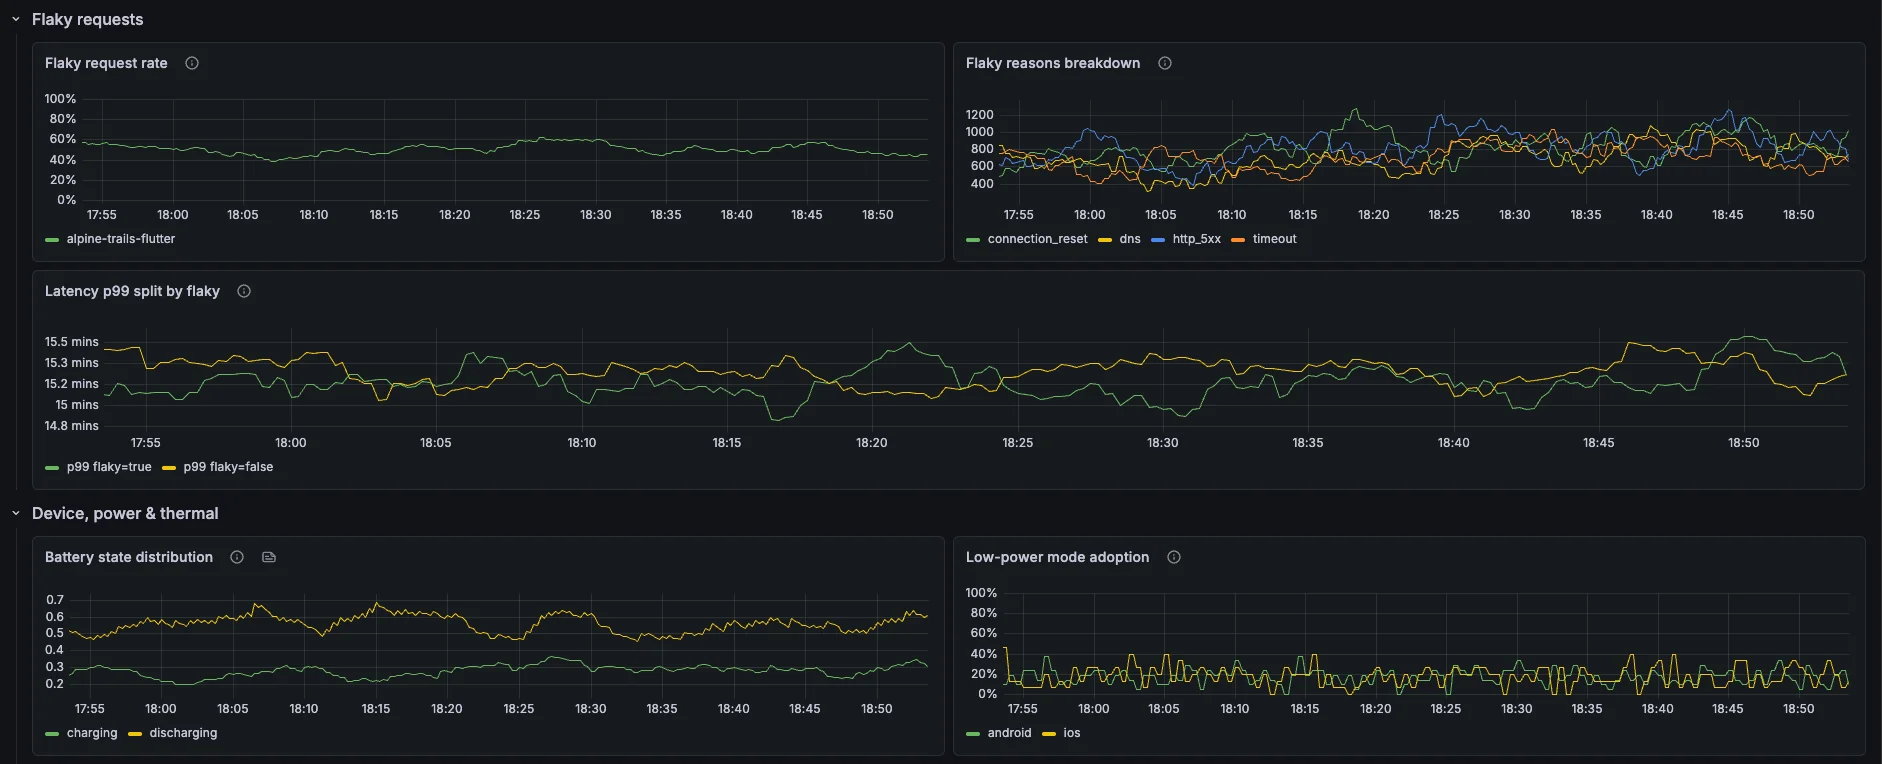
Telemetry it reads
| Key | Kind | On this dashboard |
|---|---|---|
flutter.frame.build_ms | Dartastic | Build-phase p50/p95/p99; total-frame denominator. |
flutter.frame.raster_ms | Dartastic | Raster-phase p50/p95/p99. |
flutter.frame.dropped_total | Dartastic | Frozen/severe frame rates and the worst-screens table. |
flutter.frame.jank_ratio | Dartastic | Rolling jank % scorecard and build-vs-fleet comparison. |
flutter.vsync.deadline_miss_max_ns | Dartastic | Worst vsync deadline miss in the window. |
flutter.vsync.deadline_miss_count | Dartastic | Late frames per window. |
traces_spanmetrics_calls_total | Derived | Attributed-frame counts and symbolized-attribution rate, from jank-attribution spans. |
traces_spanmetrics_latency | Derived | Frame-overrun quantiles for attributed frames. |
dartastic.jank.attribution.symbols_resolved | Dartastic | Marks attributions with resolved symbols; filters the suspects tables. |
dartastic.jank.attribution.app_frame.function | Dartastic | The app function blamed for a janky frame — the top-suspects column. |
dartastic.frame.overrun | Dartastic | Seconds past the frame deadline; sorts the jank suspects. |
flutter.anr.events_total | Dartastic | ANR events by severity and by screen. |
flutter.anr.duration_ms | Dartastic | Hang-duration percentiles. |
app.hang.duration_ms | Dartastic | App hang time from iOS MetricKit. |
process.runtime.dart.heap.used_bytes | Dartastic | Dart heap used. |
process.runtime.dart.heap.capacity_bytes | Dartastic | Dart heap capacity line. |
process.runtime.dart.gc.collections | Dartastic | GC collections per minute. |
process.runtime.dart.gc.duration_ms | Dartastic | GC pause p95 by GC generation. |
process.runtime.dart.isolates_count | Dartastic | Live isolate count. |
process.runtime.dart.native_heap.allocated_bytes | Dartastic | Native (non-Dart) heap — the plugin-leak signature line. |
process.memory.usage | OTel | Resident memory (RSS). |
memory_pressure.event | Dartastic | OS memory-pressure events by source and level. |
memory_pressure.level | Dartastic | Android onTrimMemory level over time. |
flutter.session.count | Dartastic | Crash-free % and version adoption context. |
flutter.session.duration_ms | Dartastic | Session length by version. |
flutter.app.startup.duration_ms | Dartastic | TTID cold/warm/hot quantiles and the startup mix. |
flutter.navigation.duration_ms | Dartastic | Navigation p95 by route. |
flutter.experience.fcp_ms | Dartastic | First Contentful Paint p75. |
flutter.experience.lcp_ms | Dartastic | Largest Contentful Paint p75 and the widget-attribution leaderboard. |
flutter.experience.inp_ms | Dartastic | Interaction to Next Paint p75. |
flutter.experience.ttfb_ms | Dartastic | Time to First Byte p75. |
app.exit.count | Dartastic | ANR exit rate and exit reasons by source. |
network.bytes | Dartastic | Transfer by connection type and direction (MetricKit). |
http.client.request.duration | OTel | Flaky-request rate and latency split flaky vs not. |
device.battery.state | Dartastic | Battery-state distribution. |
device.battery.low_power_mode | Dartastic | Low-power-mode adoption by platform. |
device.thermal_state.event | Dartastic | Thermal-state distribution by state and platform. |
service.name | OTel | Service picker; on every query. |
app.build_id | OTel | Build picker and per-version splits. |
app.screen.name | OTel | Route picker, by-route splits, and the worst-screens join. |
app.widget.name | OTel | The LCP widget-attribution leaderboard. |
span_name | Derived | Pins the derived series to jank-attribution frames. |
flutter.frame.severity | Dartastic | Frame buckets mild | slow | severe | frozen. |
flutter.anr.severity | Dartastic | ANR buckets info | mild | severe. |
session.status | Dartastic | Crash-free and adoption outcome filters. |
app.start.type | Dartastic | cold | warm | hot | prewarmed startup split. |
app.exit.reason | Dartastic | Exit-reason filters (anr, oom, …). |
dartastic.source | Dartastic | Metric provenance: android | metrickit. |
process.runtime.dart.gc.type | Dartastic | GC generation split (young | old). |
dartastic.memory_pressure.level | Dartastic | Memory-pressure level split (onTrimMemory levels). |
os.type | OTel | By-platform splits on vitals, battery, and thermal panels (resource attribute). |
dartastic.battery.state | Dartastic | Battery-state split. |
dartastic.thermal.state | Dartastic | Thermal-state split. |
network.connection.type | OTel | Network-transfer split (wifi | cell, …). |
network.io.direction | OTel | Network-transfer split (transmit | receive). |
dartastic.network.flaky | Dartastic | Marks requests made under a flaky network. |
dartastic.network.flaky.reason | Dartastic | Why the network was judged flaky (p99_latency, connectivity_changes, …). |
Mobile Release Health
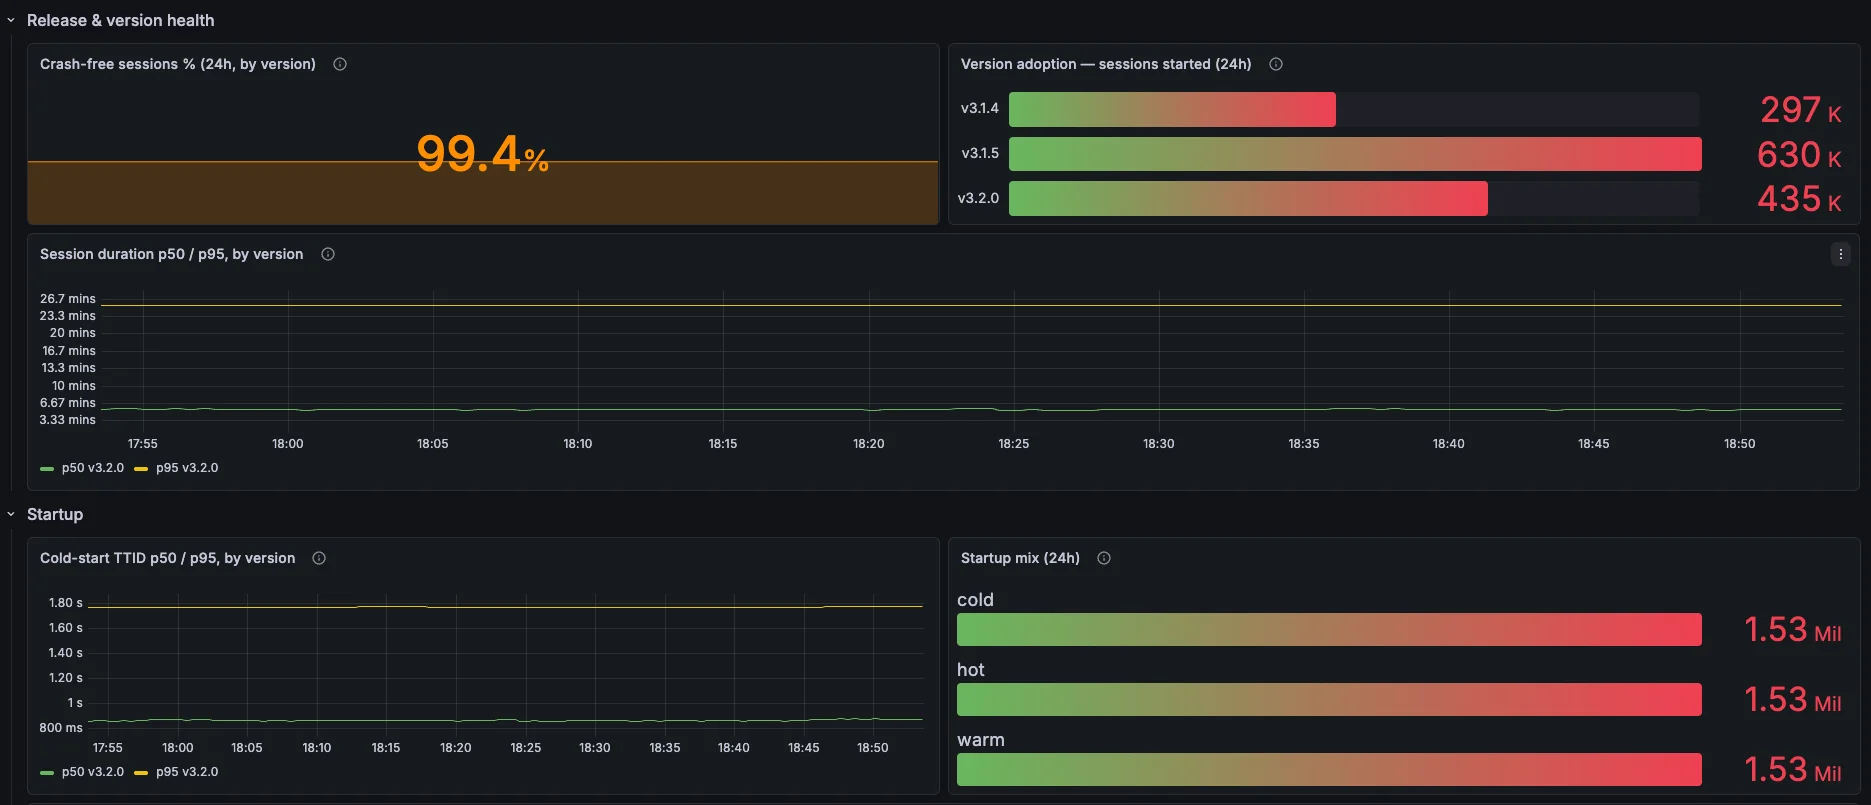
The rollout dashboard: is the build you shipped yesterday better or worse than the one before it? Everything is split by app.build_id and read as a delta against the previous release.
Sections
- Adoption — each build's share of sessions over time: the S-curve of a rollout, and the tail of stragglers on old versions.
- Crash-free by build — crash-free sessions % per build side by side. The question this dashboard exists to answer, answered first.
- Session outcomes — the full session taxonomy (started · ok · errored · crashed · abnormal) per build. "Abnormal" (the OS killed us: OOM, watchdog) rising without "crashed" rising is invisible in crash reporters — and plainly visible here.
- Exit reasons —
app.exit.countby reason (normal · memory_pressure · anr · oom · watchdog · bad_access · cpu_limit) per build: why sessions ended abnormally. - Vitals delta & network — app start, frame severities, and network flakiness as new-build-vs-baseline comparisons. Flakiness is normally a small single-digit percentage; a release that doubles it shipped a networking bug.
Telemetry it reads
| Key | Kind | On this dashboard |
|---|---|---|
flutter.session.count | Dartastic | Crash-free %, session outcomes, adoption curves, release tables, and the "build adopted" annotation. |
app.exit.count | Dartastic | ANR/OOM stats and exits-by-reason per build. |
app.exit.trace.available | Dartastic | Exits that have a stack trace available. |
app.exit.memory.pss | Dartastic | Median memory footprint at exit (Android). |
flutter.app.startup.duration_ms | Dartastic | Cold TTID p95, this build vs baseline. |
flutter.experience.fcp_ms | Dartastic | First Contentful Paint p75 and trend. |
flutter.experience.lcp_ms | Dartastic | Largest Contentful Paint p75 and trend. |
flutter.experience.inp_ms | Dartastic | Interaction to Next Paint p75 and trend. |
flutter.experience.ttfb_ms | Dartastic | Time to First Byte p75. |
http.client.request.duration | OTel | Flaky-request rate and the flaky-reason breakdown. |
memory_pressure.event | Dartastic | Memory-pressure events (24 h). |
memory_pressure.level | Dartastic | Pressure level over time by platform. |
device.battery.level | Dartastic | Median battery level. |
device.battery.state | Dartastic | Battery-state distribution over time. |
device.battery.low_power_mode | Dartastic | Low-power-mode share. |
device.thermal_state | Dartastic | iOS thermal state over time; devices at serious/critical. |
device.thermal_state.event | Dartastic | Thermal events (24 h). |
service.name | OTel | Service picker; on every query. |
app.build_id | OTel | The build under review AND the baseline build — every panel keys on it. |
os.type | OTel | Platform picker and iOS-only filters. |
service.instance.id | OTel | Counts distinct devices reporting hot thermal states. |
session.status | Dartastic | started | ok | errored | crashed | abnormal outcome taxonomy. |
app.exit.reason | Dartastic | Exit-reason filters and splits (anr, oom, …). |
app.start.type | Dartastic | Cold-start filter for the TTID comparison. |
dartastic.network.flaky | Dartastic | Flaky-request filter. |
dartastic.network.flaky.reason | Dartastic | Flaky-reason pie and per-minute series. |
process.memory.usage | OTel | Picker source only (build and platform value lists). |
traces_spanmetrics_calls_total | Derived | Picker source only (service value list). |
RUM — Session Explorer
Real-user monitoring at the session grain: how many sessions are starting, how they end, where users get frustrated — and the tables that find the one session you need. Spot the pattern here, then open the session in the Session Timeline.
Sections
- Session pulse — sessions started, crash-free sessions %, screen dwell p75, and interaction-to-next-view p90: the numbers that say whether real users are having a normal day, before you look at a single trace.
- The frustration trio — error taps (the tap raised an error), rage taps (the same target hammered in quick succession), and dead taps (the tap did nothing), split by type and by screen. This is where "users are fighting the UI" becomes a ranked list of screens.
- Find a session — tables of concrete sessions, cut by outcome and frustration, where every
session.idis a click-through: one click opens that session's full story in the Session Timeline.
Telemetry it reads
| Key | Kind | On this dashboard |
|---|---|---|
flutter_session_count_total | Dartastic | Sessions started and the crash-free % on the session pulse. |
session_status | Dartastic | Outcome split on the pulse (metric label: started | ok | errored | crashed | abnormal). |
dartastic_frustration_signal_count_total | Dartastic | Every counted frustration signal — the one source behind the trio. |
dartastic_frustration_signal_type | Dartastic | error_tap | rage_tap | dead_tap split (metric label). |
app_screen_name | Dartastic | Frustration-by-screen split (metric label). |
dartastic_screen_time_spent_milliseconds | Dartastic | Screen dwell p75. |
dartastic_screen_interaction_to_next_view_milliseconds | Dartastic | Interaction-to-next-view p90. |
session.id | OTel | The click-through key in every "Find a session" table (span record attribute). |
user.id | OTel | Finds all sessions belonging to one user. |
app.screen.name | OTel | Screen filters on the find-a-session tables. |
dartastic.exception.type | Dartastic | Labels errored and crashed sessions with the exception behind them. |
RUM — Session Timeline
One session, in order — the dashboard you open when a ticket says "it broke for me around three o'clock." Pick the session at the top; everything below is that session's journey, chronologically.
Sections
- Pick a session — the session table on top: filter by user, outcome, and time, or arrive from the Session Explorer with the session already selected.
- The journey — screen visits and the dwell on each, the work the app did, network requests (flaky ones flagged with the reason), janky frames with their overrun depth, and errors with symbolized stacks — interleaved in the order the user lived them.
- The previous-session chain —
session.previous_idlinks each session to the one before it, so a crash on Tuesday can be walked back through Monday's warning signs.
Telemetry it reads
| Key | Kind | On this dashboard |
|---|---|---|
session.id | OTel | The session under the microscope — every panel keys on it (span record attribute). |
session.previous_id | OTel | Stitches the previous-session chain. |
user.id | OTel | Whose journey this is; finds the same user in other sessions. |
app.screen.name | OTel | The screen-visit rows of the journey. |
app.screen.id | OTel | Stable screen identity behind renamed or reused display names. |
dartastic.frame.overrun | Dartastic | Jank rows: how far past its deadline each janky frame ran. |
dartastic.network.flaky | Dartastic | Flags network rows made under a flaky connection. |
dartastic.network.flaky.reason | Dartastic | Why the network was judged flaky (p99_latency, connectivity_changes, …). |
dartastic.exception.type | Dartastic | Error rows in the journey, with the symbolized stack alongside. |
Session Replay
Session replay lets you watch a session instead of scrolling it: the screens someone moved through and what they did on each one, played back in order.
Which plans include it
Session replay is part of Dartastic Native OTel Pro. It is included wherever that engine is, which means:
- Dartastic Native OTel Pro
- Dartastic Cloud Observatory Pro
- Dartastic Hosted Observatory, every tier
- Dartastic Self-hosted
The Dev plans, Dartastic Native OTel Dev and Dartastic Cloud Observatory Dev, do not include it.
It is one entitlement, not a ladder. Every replay fidelity is part of it, from an event timeline through to a full-fidelity replay. Fidelity decides what a session costs to keep, not whether you are allowed to record one. See RUM pricing for what each level costs per thousand sessions.
What a replay contains
At the default fidelity a replay is the shape of the session: the screens, the layout and the interactions, redrawn. No text and no images are captured, so there is nothing sensitive in it to begin with. Higher fidelities capture more of what was on screen, which is why fidelity is set per app and is worth agreeing with whoever owns privacy at your company before you raise it.
Getting to a replay
- Open RUM — Session Explorer and pick a session.
- You land on RUM — Session Timeline for that session.
- Click Watch this session. The player opens on that session.
Capture is off by default
This is permanent behaviour, not a rollout state. A build that does not ask for replay installs no frame callback, no pointer listener and no buffer, so it costs nothing. You enable capture in your app's configuration; until you do, sessions have a Timeline but no replay, and the player will say so.
Mobile first. Capture buffers on the device and is designed so a session where nothing goes wrong need not upload anything at all — we do not trade a user's battery for a better answer.
When there is nothing to play
Two outcomes that look similar but mean different things, and the player deliberately keeps them apart:
- No replay was captured for this session. The session is real, replay capture simply was not enabled for it. The player never substitutes sample data to fill the gap.
- The store could not be reached. The player reports what the query returned, status included, so an infrastructure problem never reads as "nothing happened."
Dart Server (Linux)
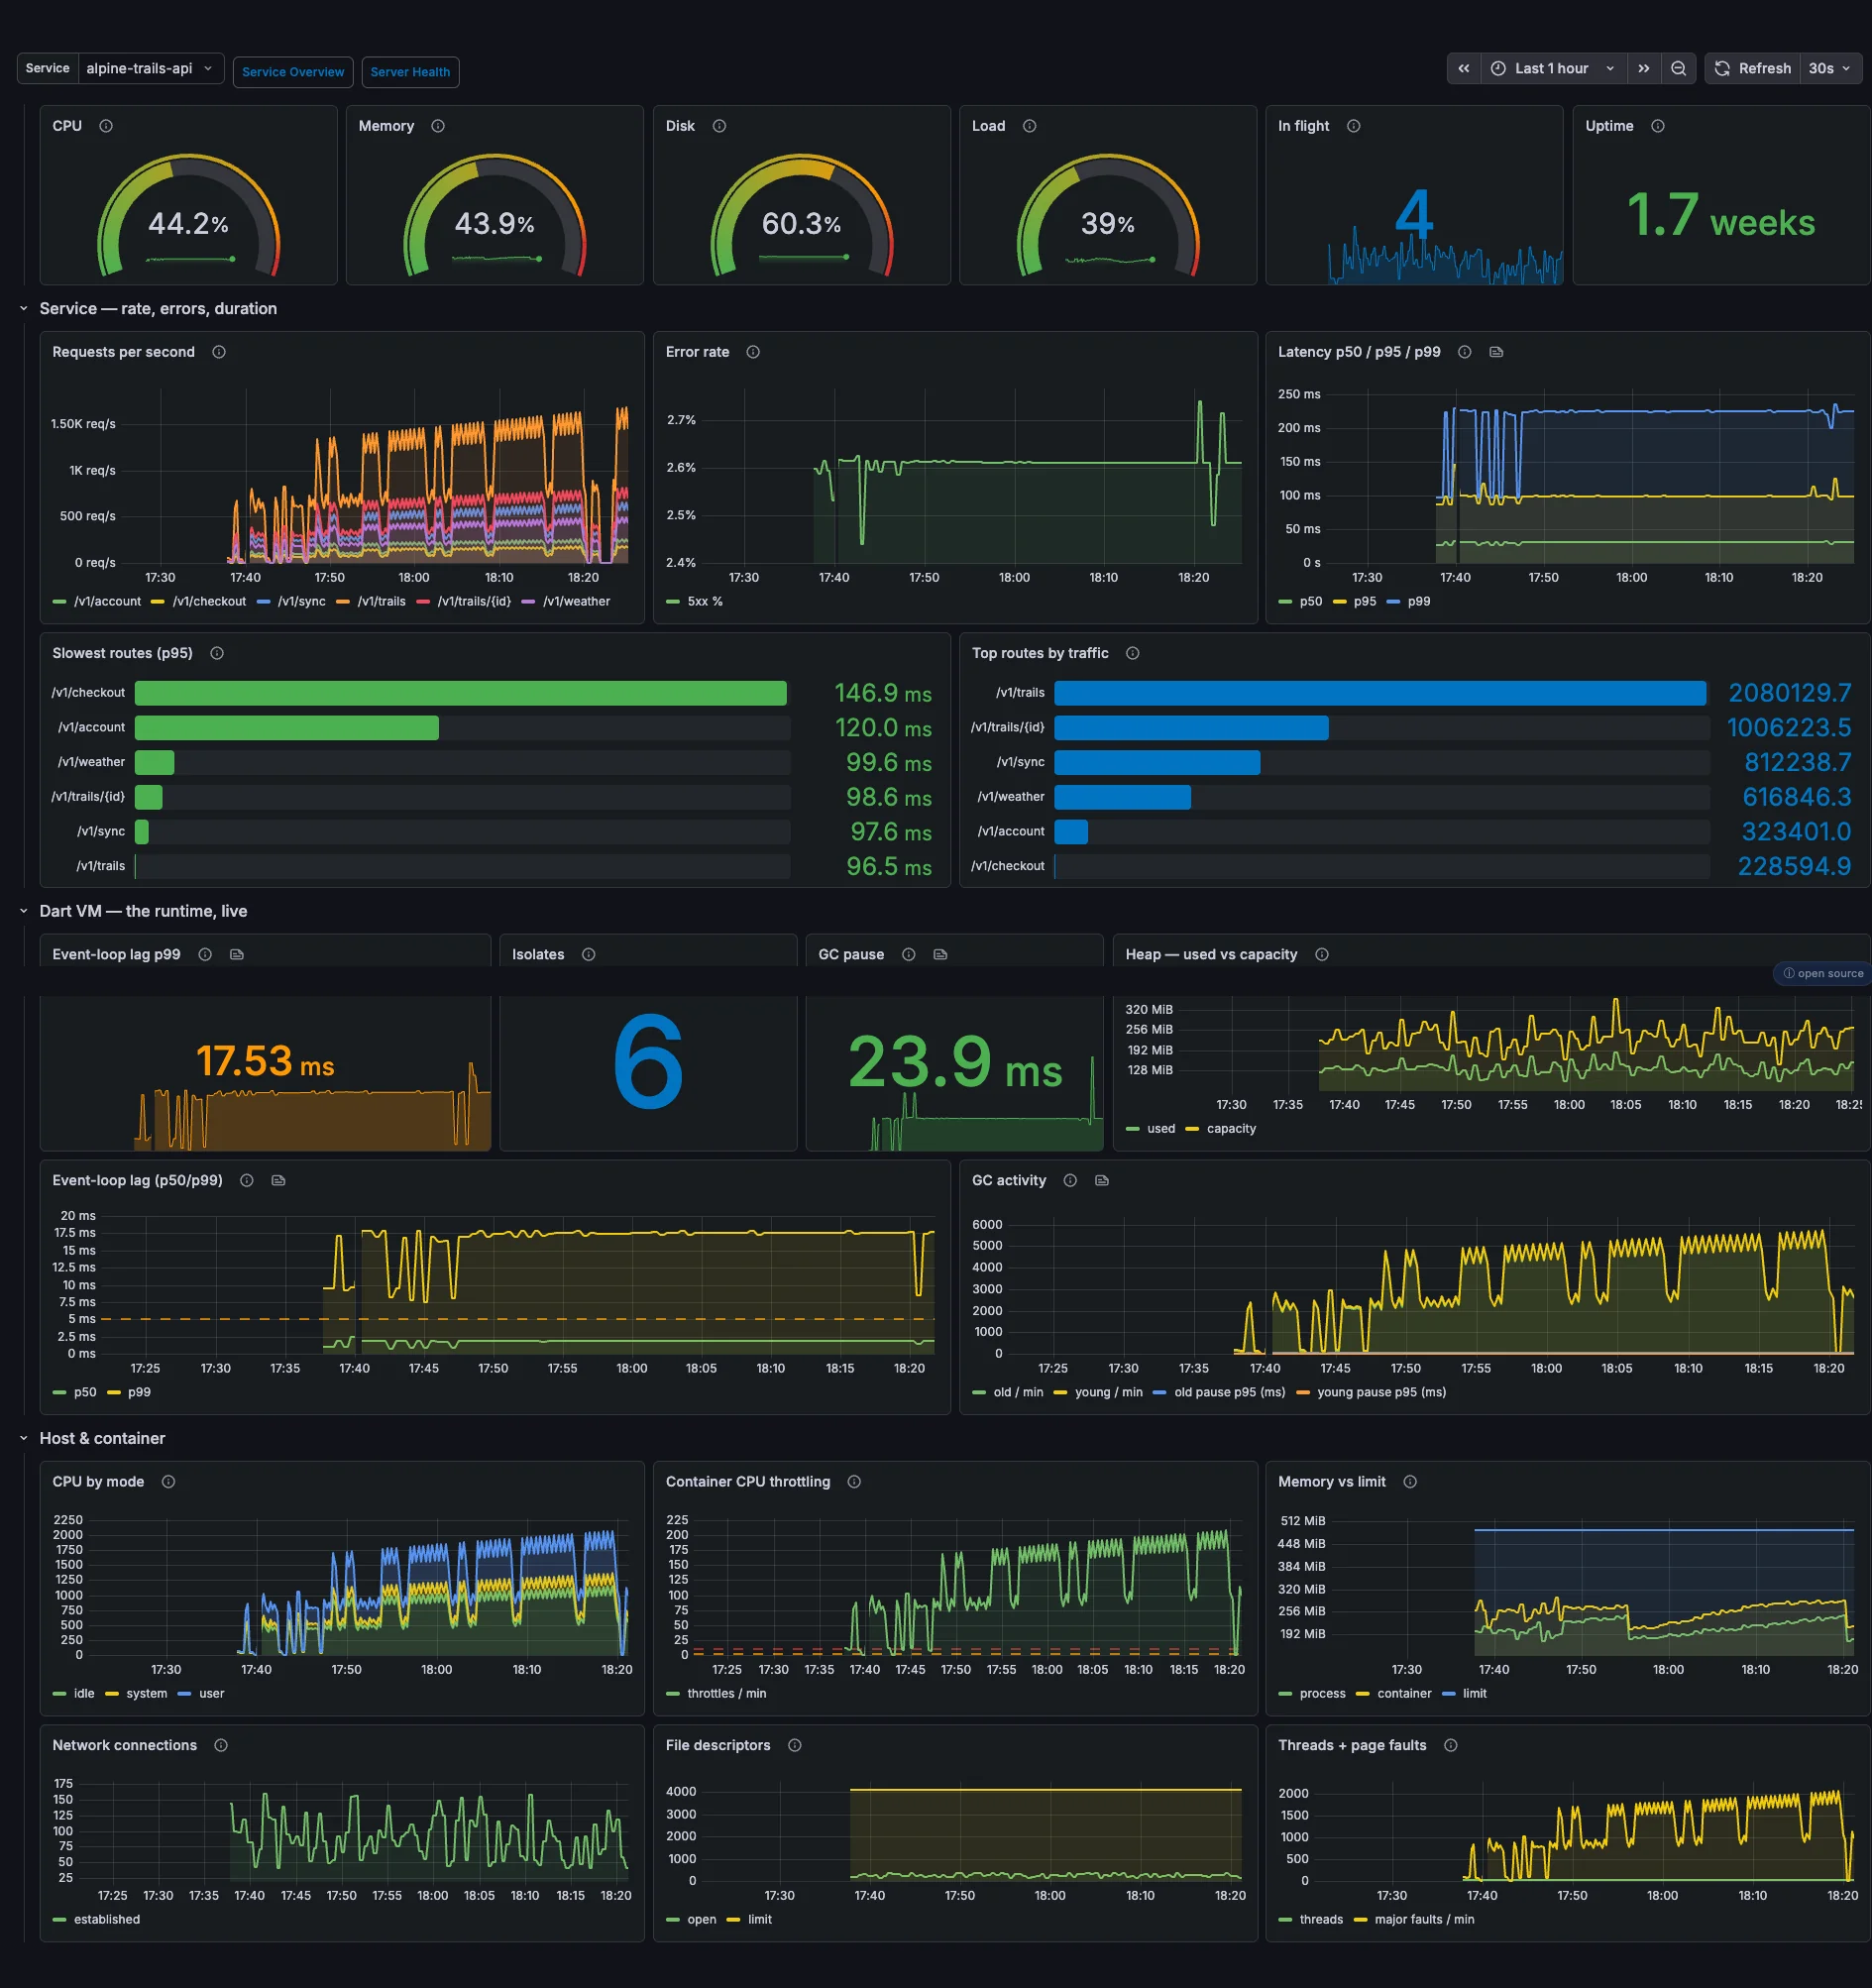
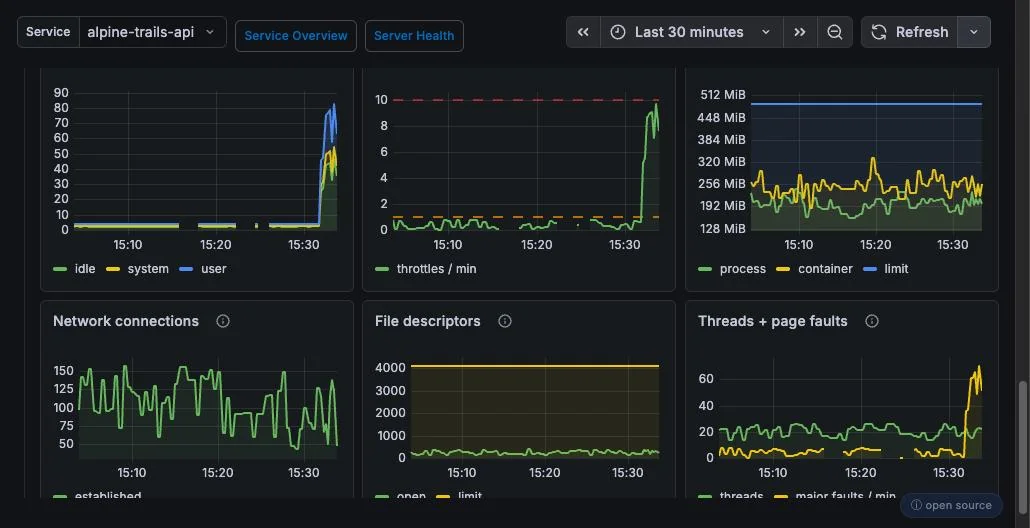
The flagship server dashboard for Dart backends — Serverpod, shelf, gRPC, anything — in Docker on Linux. Three altitudes on one page: the service's traffic, the Dart VM inside it, and the host and container underneath, so "the API is slow" can be answered without changing dashboards.
Sections
- Requests, errors, duration — the classic RED row from the standard
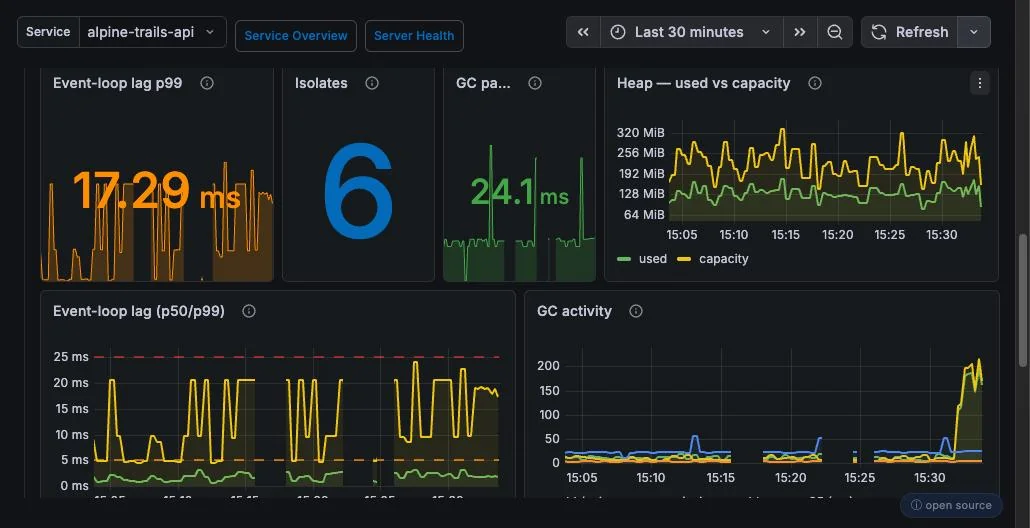
http.server.request.durationhistogram: request rate, error rate, and p50/p95/p99 latency, by route. This is the row you alert on. - Dart VM runtime — the pane no generic APM has: event-loop lag (how late timers fire — the single best "is this isolate healthy" signal), Dart heap used vs capacity, GC pause time and frequency, and isolate count. Rising lag with flat CPU means the event loop is blocked, not the machine.
- Host — CPU, load, memory, filesystem, and network for the box, from the standard
system.*metrics. - Container — cgroup view: container CPU throttling and memory against limits. Throttling with idle host CPU means your limits are wrong, not your code — a five-second diagnosis on this row.
Telemetry it reads
Server-side families come from the dartastic_opentelemetry_dart_metrics package (setup).
| Key | Kind | On this dashboard |
|---|---|---|
http.server.request.duration | OTel | The whole RED row: rate, 5xx %, p50/p95/p99, slowest and busiest routes. |
http.server.active_requests | OTel | In-flight requests. |
dartastic.event_loop.lag | Dartastic | Event-loop lag p50/p99 (seconds on the wire, shown as ms). |
process.runtime.dart.heap.used_bytes | Dartastic | Dart heap used line. |
process.runtime.dart.heap.capacity_bytes | Dartastic | Dart heap capacity line. |
process.runtime.dart.gc.collections | Dartastic | GC collections per minute by generation. |
process.runtime.dart.gc.duration_ms | Dartastic | GC pause p95 (old-gen stat; per-type series). |
process.runtime.dart.isolates_count | Dartastic | Live isolates. |
system.cpu.time | OTel | CPU busy gauge, core count, CPU by mode. |
system.cpu.load_average.1m | OTel | Per-core load gauge. |
system.filesystem.usage | OTel | Disk used % on the data mount. |
system.network.connections | OTel | Established TCP connections. |
container.memory.usage | OTel | Container memory vs limit. |
container.memory.limit | Dartastic | The cgroup memory-limit line. |
container.cpu.throttled.count | Dartastic | CPU throttle events per minute — the "limits are wrong" panel. |
process.memory.usage | OTel | Process RSS in the memory-vs-limit panel. |
process.uptime | OTel | Process uptime stat. |
process.open_file_descriptors | Dartastic | Open FDs line. |
process.open_file_descriptors.limit | Dartastic | FD limit line. |
process.threads | Dartastic | Thread count. |
process.memory.faults | Dartastic | Major page faults per minute. |
service.name | OTel | Service picker; on every query. |
http.route | OTel | Per-route splits in rate and latency panels. |
http.response.status_code | OTel | The 5xx error-rate filter. |
process.runtime.dart.gc.type | Dartastic | GC generation split (young | old). |
cpu.mode | OTel | CPU time split by mode (user | system | idle | iowait | steal). |
system.filesystem.state | OTel | Filesystem used/free split. |
network.connection.state | OTel | TCP connection states (registry vocabulary). |
mount | Dartastic | Filesystem mount filter. |
cpu | Dartastic | Core identity — derives the core count for load normalization. |
system.paging.fault.type | OTel | Page-fault type filter (major | minor). |
Service Overview
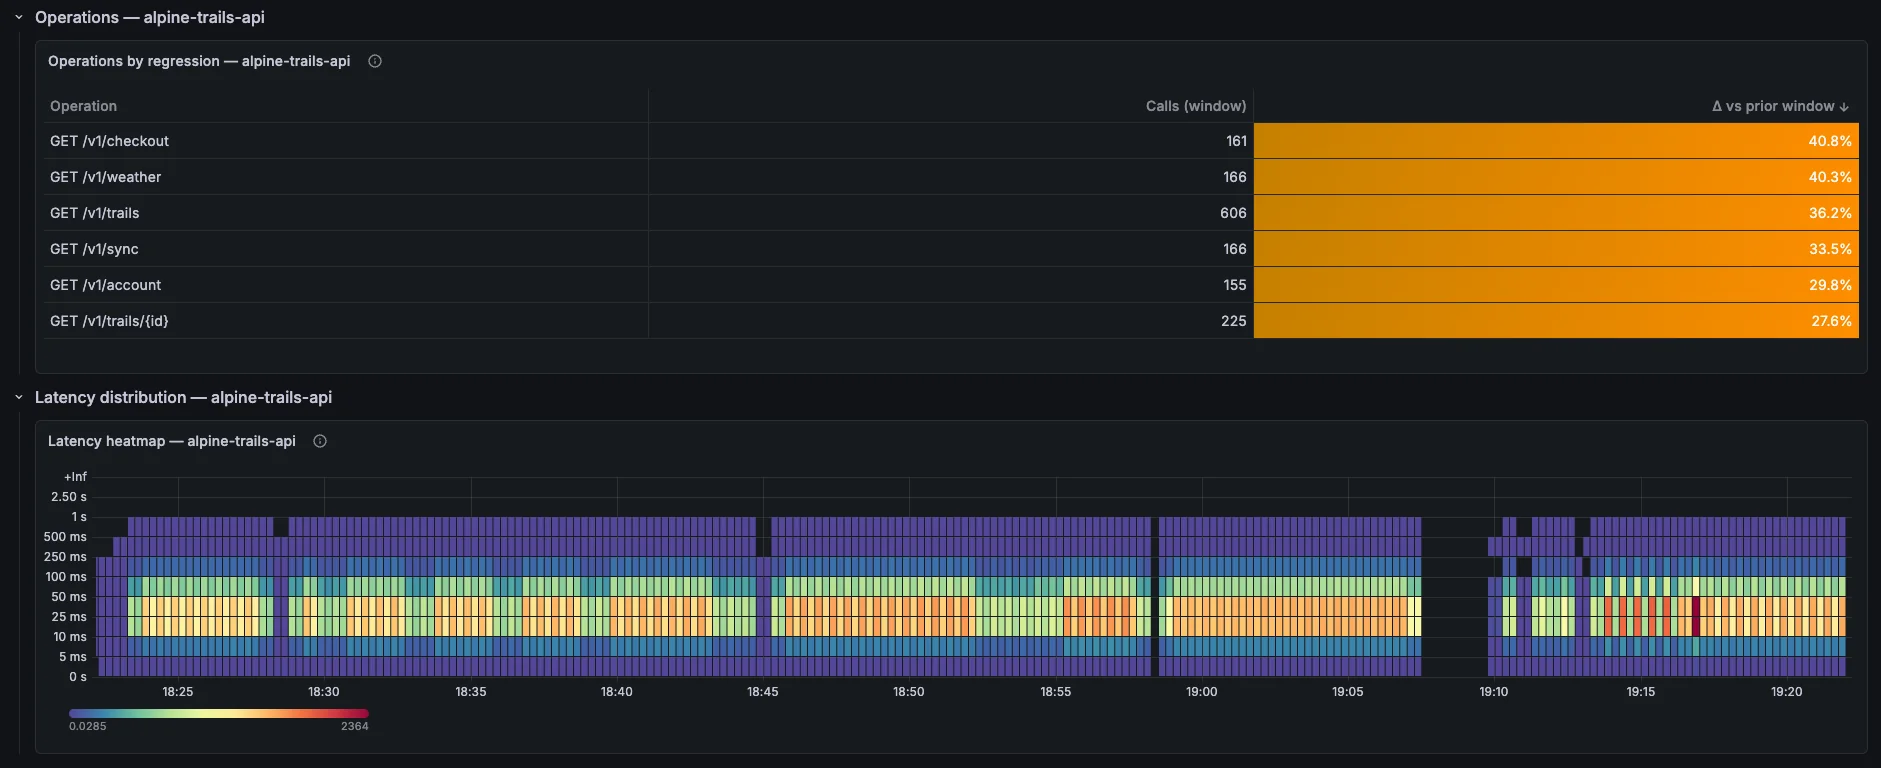
Every service reporting to your Dartastic Observatory on one screen — backends, workers, and apps side by side, ranked so regressions float to the top.
Sections
- Fleet RED table — one row per
service.name: rate, errors, latency percentiles, sorted by change against the previous window rather than absolute value, so the service that just got slower outranks the one that's always been busy. - Errors by service — who is failing, trending, with click-through to that service's traces.
- Top endpoints — the busiest and slowest operations across the fleet, from span-derived metrics.
Telemetry it reads
| Key | Kind | On this dashboard |
|---|---|---|
http.server.request.duration | OTel | Everything RED: totals, 5xx rates, quantiles, per-service/route rate, latency heatmap, status mix. |
traces_spanmetrics_calls_total | Derived | The operations-regression table: per-operation volume, delta vs the prior window. |
span_name | Derived | Operation identity in the regression table. |
service.name | OTel | Per-service splits, the picker, and the error-trace drill-down filter. |
http.route | OTel | Per-route request-rate split. |
http.response.status_code | OTel | 5xx filters and the status-code mix. |
Server Health
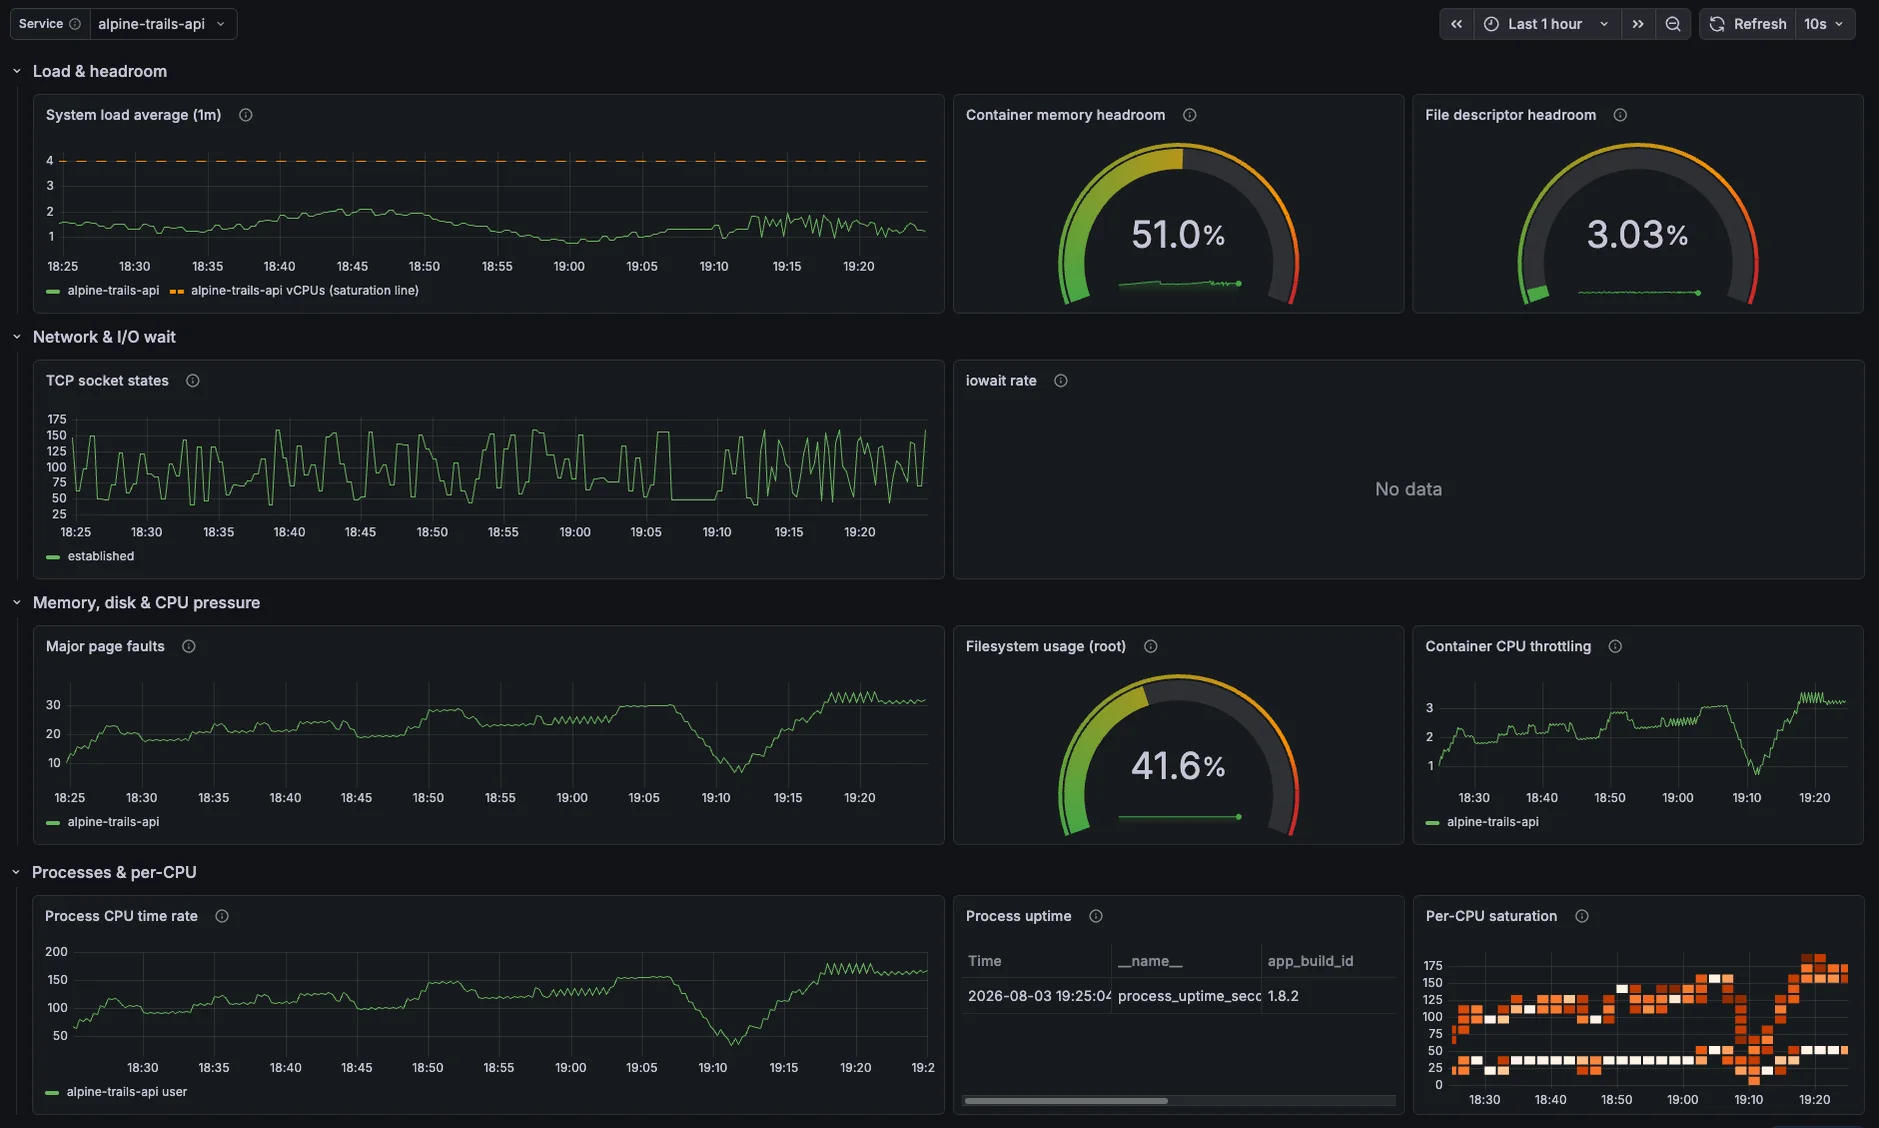
The infrastructure counterpart to Service Overview: every host, USE-style — utilization, saturation, errors — for capacity planning and "is it the machine?" triage.
Sections
- CPU & load — utilization and load average per host; sustained load above core count is the saturation signal.
- Memory — used vs available with swap activity: the difference between "using RAM as cache" (fine) and "about to OOM" (not).
- Disk — I/O throughput and space trends, so full disks are a forecast, not a page at 3 a.m.
- Network — throughput and error/drop counts per interface.
Telemetry it reads
From dartastic_opentelemetry_dart_metrics or any OTel host-metrics collector.
| Key | Kind | On this dashboard |
|---|---|---|
system.cpu.load_average.1m | OTel | 1-minute load series; the service picker source. |
system.cpu.time | OTel | vCPU saturation, iowait rate, per-CPU heatmap. |
system.filesystem.usage | OTel | Root-filesystem used/total gauge. |
system.network.connections | OTel | TCP socket states over time. |
container.memory.usage | OTel | Container memory-headroom numerator. |
container.memory.limit | Dartastic | Memory-headroom denominator. |
container.cpu.throttled.count | Dartastic | Container CPU throttling rate. |
process.cpu.time | OTel | Process CPU (user + system). |
process.uptime | OTel | Uptime table. |
process.open_file_descriptors | Dartastic | FD-headroom numerator. |
process.open_file_descriptors.limit | Dartastic | FD-headroom denominator. |
process.memory.faults | Dartastic | Major page-fault rate. |
service.name | OTel | Host/service picker; on every query. |
cpu | Dartastic | Per-CPU grouping in the saturation heatmap. |
cpu.mode | OTel | CPU iowait/idle split. |
system.filesystem.state | OTel | Filesystem used/free split. |
network.connection.state | OTel | TCP connection states (registry vocabulary). |
mount | Dartastic | Root-filesystem filter. |
system.paging.fault.type | OTel | Page-fault type filter (major | minor). |
Pro at a Glance
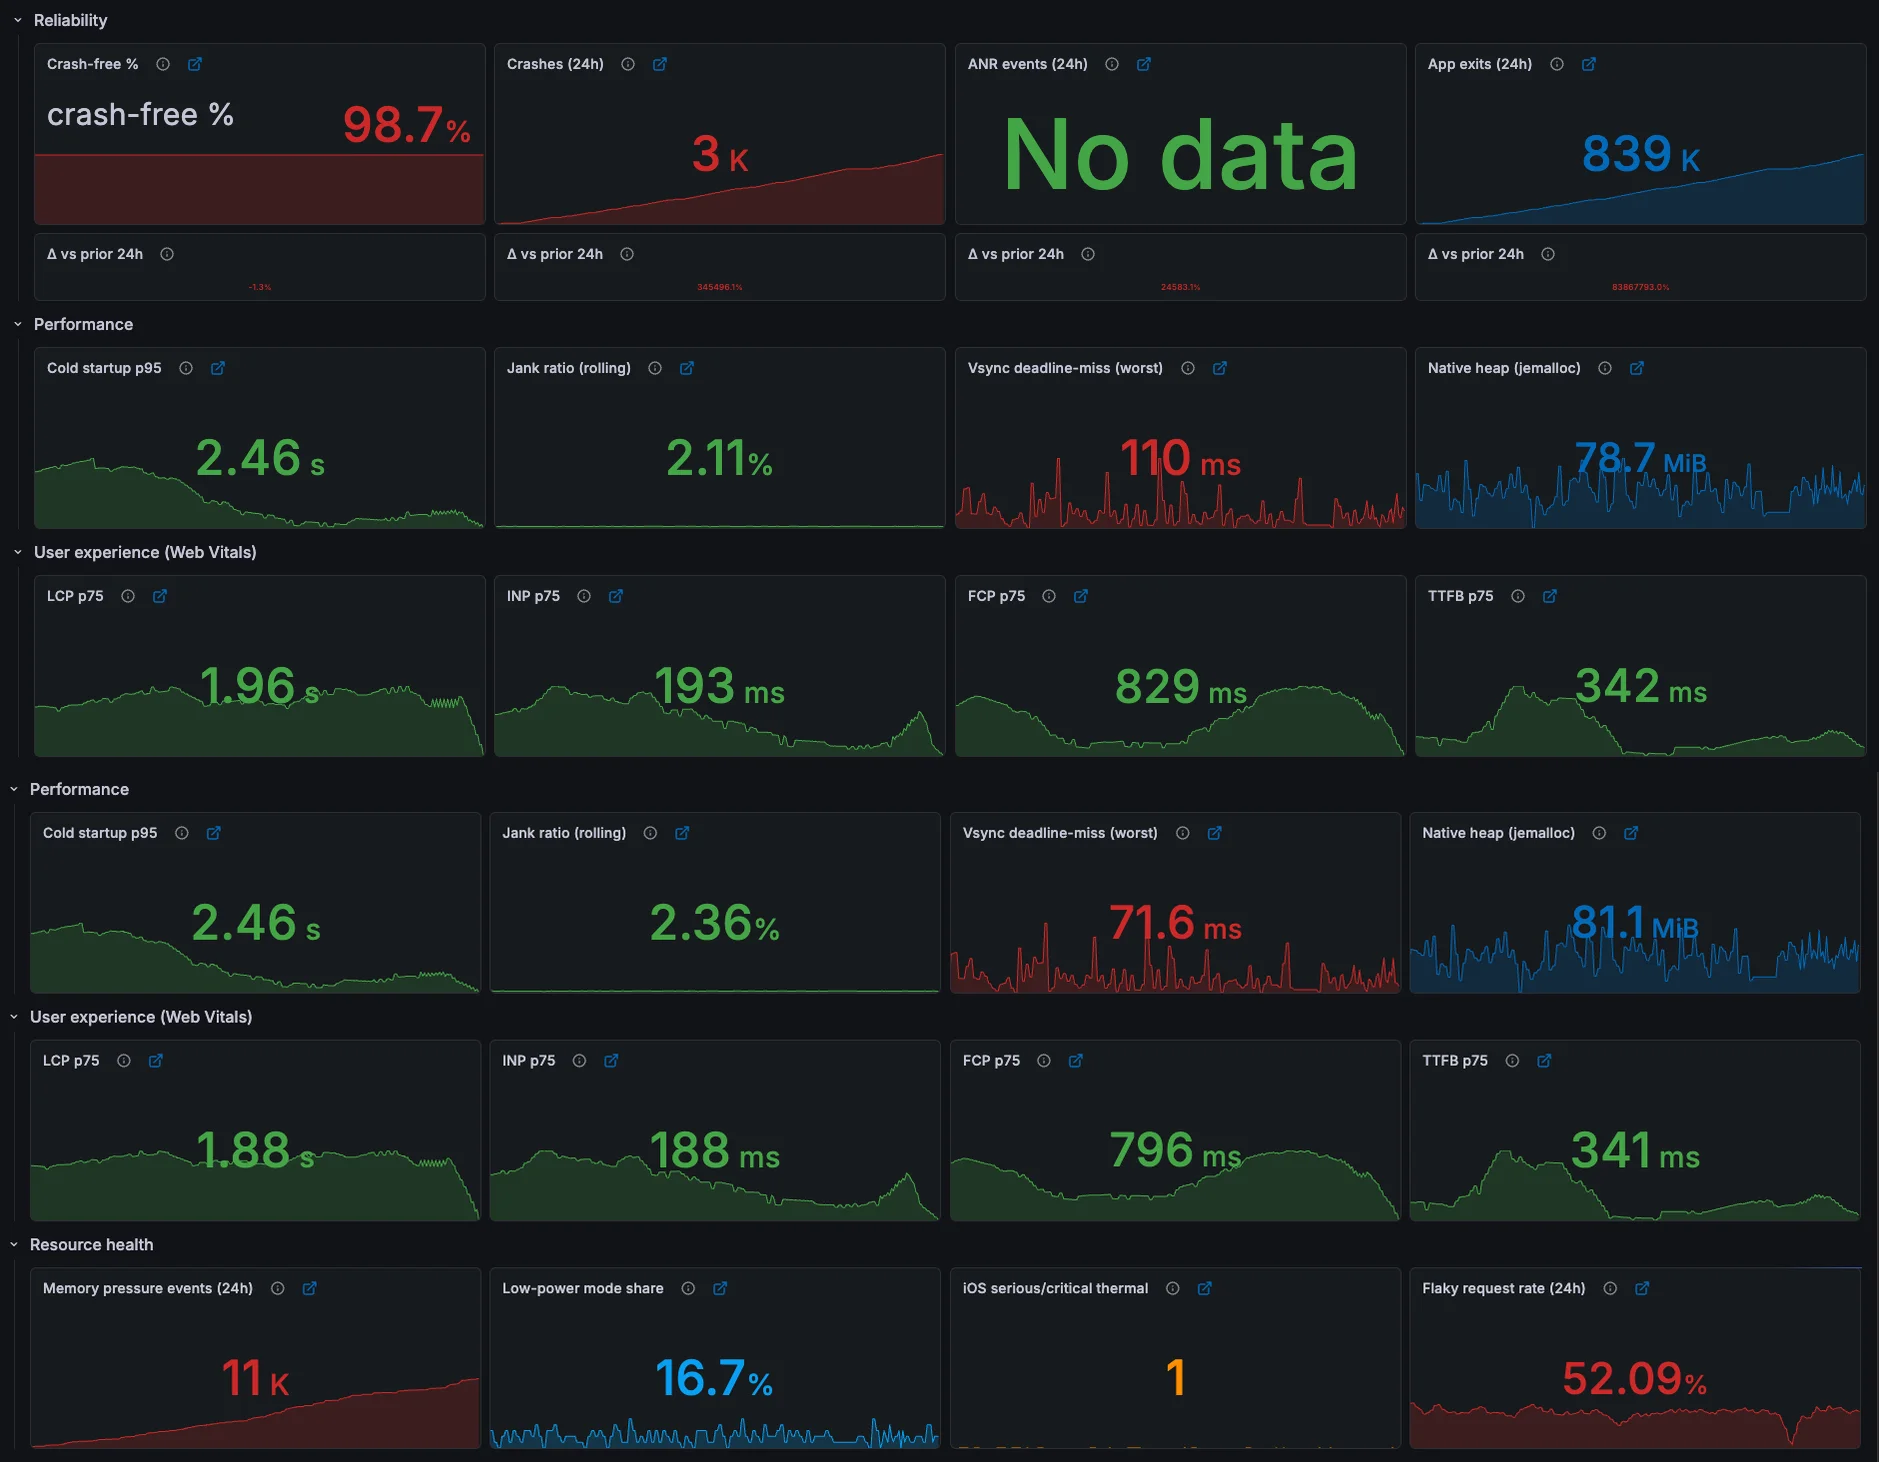
One panel per Pro-engine capability — ANR watchdog, jank attribution, network flakiness, memory pressure, adaptive backpressure, symbolized crashes — each linking to the dashboard that goes deep. It doubles as a coverage check: a Pro feature showing "No data" here means that capability isn't reaching your Dartastic Observatory (see the engine toggles).
Telemetry it reads
| Key | Kind | On this dashboard |
|---|---|---|
flutter.session.count | Dartastic | Crash-free % and crash count with prior-24 h deltas. |
flutter.anr.events_total | Dartastic | Severe ANR events (24 h) and delta. |
app.exit.count | Dartastic | OS-driven app exits (24 h) and delta. |
flutter.app.startup.duration_ms | Dartastic | Cold-startup p95. |
flutter.frame.jank_ratio | Dartastic | Rolling jank ratio. |
flutter.vsync.deadline_miss_max_ns | Dartastic | Worst vsync deadline miss. |
process.runtime.dart.native_heap.allocated_bytes | Dartastic | Native-heap gauge (Dartastic Native OTel Pro capability check). |
flutter.experience.fcp_ms | Dartastic | FCP p75. |
flutter.experience.lcp_ms | Dartastic | LCP p75. |
flutter.experience.inp_ms | Dartastic | INP p75. |
flutter.experience.ttfb_ms | Dartastic | TTFB p75. |
memory_pressure.event | Dartastic | OS memory-pressure events (24 h). |
device.battery.low_power_mode | Dartastic | Low-power-mode session share. |
device.thermal_state | Dartastic | iOS devices at thermal state serious or worse. |
http.client.request.duration | OTel | Flaky network request rate. |
system.cpu.load_average.1m | OTel | Box load average. |
process.memory.usage | OTel | Liveness checks for the box services; build-picker source. |
traces_spanmetrics_calls_total | Derived | Picker source only (service value list). |
dartastic_ai_gateway_queries_total | Dartastic | AI query volume and refused-% guardrail (Prometheus-native, scraped from the AI gateway). |
dartastic_ai_gateway_cost_micros_total | Dartastic | Estimated AI cost and top single-customer cost. |
dartastic_ai_gateway_budget_spend_micros | Dartastic | AI budget-used numerator. |
dartastic_ai_gateway_budget_micros | Dartastic | The configured daily AI budget cap. |
service.name | OTel | Service picker and liveness selectors. |
app.build_id | OTel | Build picker. |
session.status | Dartastic | Crash-free outcome filters. |
flutter.anr.severity | Dartastic | ANR severity filter. |
app.start.type | Dartastic | Cold-start filter. |
os.type | OTel | iOS filter on the thermal panel. |
service.instance.id | OTel | Distinct-device count on the thermal panel. |
dartastic.network.flaky | Dartastic | Flaky-request filter. |
outcome | Dartastic | AI-query result filter (the refused-% guardrail). |
customer_id | Dartastic | Top single-customer AI cost split. |
The Semantics Behind the Panels
Dartastic is standards-first, and the tables above reflect three deliberate tiers. Where an OpenTelemetry semantic convention exists, the SDK emits it as-is (service.name, http.server.request.duration, system.*). Namespaces that Dart and Flutter need but the registry doesn't define yet — flutter.*, process.runtime.dart.*, session and app-exit families — are deliberately not vendor-prefixed: they are the names we're proposing through the OpenTelemetry SIG process, so standardizing them won't be a breaking rename. Signals that are genuinely Dartastic — jank attribution, network-flakiness verdicts, symbolized stacks — carry the dartastic. prefix. Every key each dashboard reads is listed in its own Telemetry it reads table above — dashboards and SDK share one published catalog, so those tables are what's on the wire, useful for building your own panels and alerts too.
Units follow OpenTelemetry conventions (durations in seconds on the wire where the convention says so — dashboards convert to ms where that reads better; mobile-native histograms carry their unit in the name, like _ms). Legacy key spellings from earlier SDKs are dual-emitted during migration windows, so old data keeps rendering.
Looking for setup instead? Tokens, pubspec, SDK initialization, and environment variables live on the main Help & Setup page. Stuck? Support answers.