The Crashes dashboard
How sessions end, which builds, exceptions and devices have error spans, and how that is trending. No panel here is called Crashes: each says what it counts. The Crashes list, one click from Dashboards, counts crashes.
Who it is for: Whoever triages errors after a release: how bad it is, which builds and devices it hits, and whether it is getting better.
Open it from Dashboards in the Observatory: choose Crashes. It is a built-in board, so it is read-only; Save a copy makes one you can change. How every panel reads the range, its colors and its empty states is on Reading a board.
The toolbar: the filters Build, Platform and Service, each All until you pick a value, and the time range. Each menu lists the values flutter.session.count carries in the range. Each panel below names the filters that narrow it.
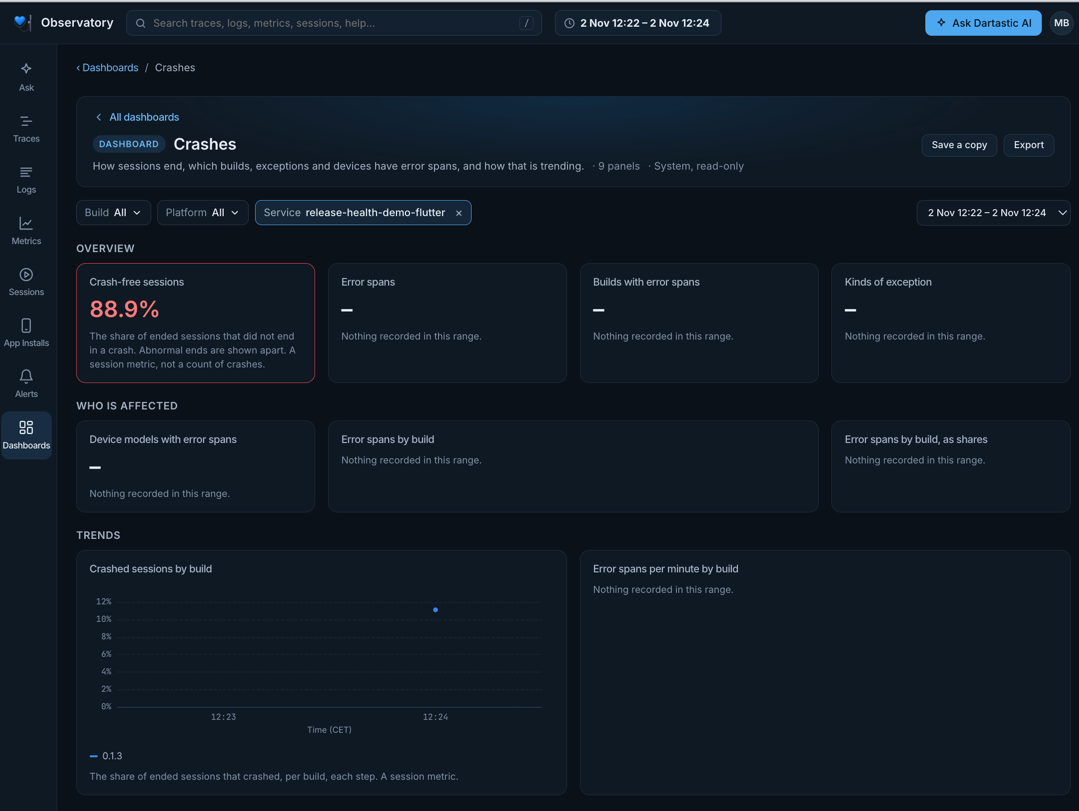
Overview
Crash-free sessions
The share of ended sessions that did not end in a crash. Abnormal ends are shown apart and do not count against it. It is a session figure, not a count of crashes: the Crashes list counts crashes.
- How it is computed: Crash-free sessions = 1 − crashed sessions / ended sessions, as a percent, the way Sentry counts it. Both come from
flutter.session.count: an ended session is one whosesession.statusis ok, errored, unhandled, crashed or abnormal, and only crashed counts against the figure. A range whose sessions all ended without a crash reads 100%. One figure for the whole picked range. - Better: Higher is better.
- Colors: The figure turns amber below 99.5% and red below 99%.
- No session ended: when no session ended in the range, it shows this instead of a figure: No session end recorded in this range, so crash-free sessions can't be computed.
- Filters: Build, Platform and Service narrow it.
- Opens: its title opens the Metric screen on
flutter.session.count.
Error spans
Spans that ended in an error, leaving out the engine's own session and unclean-exit spans. The Crashes list counts crashes.
- How it is computed: The number of spans that ended in an error, leaving out the spans named
flutter.sessionanddartastic.unclean_exit. Those two end in an error for each crashed or unclean session, so with them one crash would count two or three times. One figure for the whole picked range. - Better: Lower is better. Beside the figure, its change from the prior range of the same length: green when it moved the better way, red when it moved the other way.
- Filters: Build, Platform and Service narrow it.
- Opens: its title opens Traces.
Builds with error spans
How many builds have error spans.
- How it is computed: Distinct
app.build_idvalues among the error spans (the same two left out). One figure for the whole picked range. - Better: Lower is better.
- Filters: Build, Platform and Service narrow it.
- Opens: its title opens Traces.
Kinds of exception
Exception types on error spans.
- How it is computed: Distinct
dartastic.exception.typevalues on the error spans (the same two left out). One figure for the whole picked range. - Better: Lower is better.
- Filters: Build, Platform and Service narrow it.
- Opens: its title opens the Issues list.
Who is affected
Device models with error spans
How many device models have error spans.
- How it is computed: Distinct
device.model.identifiervalues among the error spans (the same two left out). One figure for the whole picked range. - Better: Lower is better.
- Filters: Build, Platform and Service narrow it.
- Opens: its title opens Traces.
Error spans by build
The builds with the most error spans.
- How it is computed: Error spans (the same two left out), counted per build (
app.build_id). A ranked list, each figure for the whole picked range. - Filters: Build, Platform and Service narrow it.
- Opens: its title opens Traces.
Error spans by build, as shares
Each build's share of the error spans. Compare it against each build's session share before reading a large slice as a regression.
- How it is computed: Error spans (the same two left out), counted per build. Slices of one whole, each figure for the whole picked range.
- Filters: Build, Platform and Service narrow it.
- Opens: its title opens Traces.
Trends
Crashed sessions by build
The share of ended sessions that crashed, per build, each step. A session figure.
- How it is computed: 100 × crashed sessions / ended sessions, from
flutter.session.count, one line per build. Lines, one point per step across the picked range. - No session ended: when no session ended in the range, it shows this instead of a figure: No session end recorded in this range, so crashed sessions by build can't be computed.
- Filters: Build, Platform and Service narrow it.
- Opens: its title opens the Metric screen on
flutter.session.count.
Error spans per minute by build
Error spans per minute, per build.
- How it is computed: The per-minute rate of error spans (the same two left out), one line per build. Lines, one point per step across the picked range.
- Filters: Build, Platform and Service narrow it.
- Opens: its title opens Traces.