 Dartastic Observatory
Full-stack observability where Flutter is first-class.
Dashboards to manage your mobile fleet. RUM to replay user experiences. Crash symbolization to pinpoint errors. Dartastic AI to fix them.
Deploy on shared Dartastic Cloud, a Dedicated platform of your own, or Self-Hosted infrastructure entirely inside your network.
Tracing from Flutter all the way down.
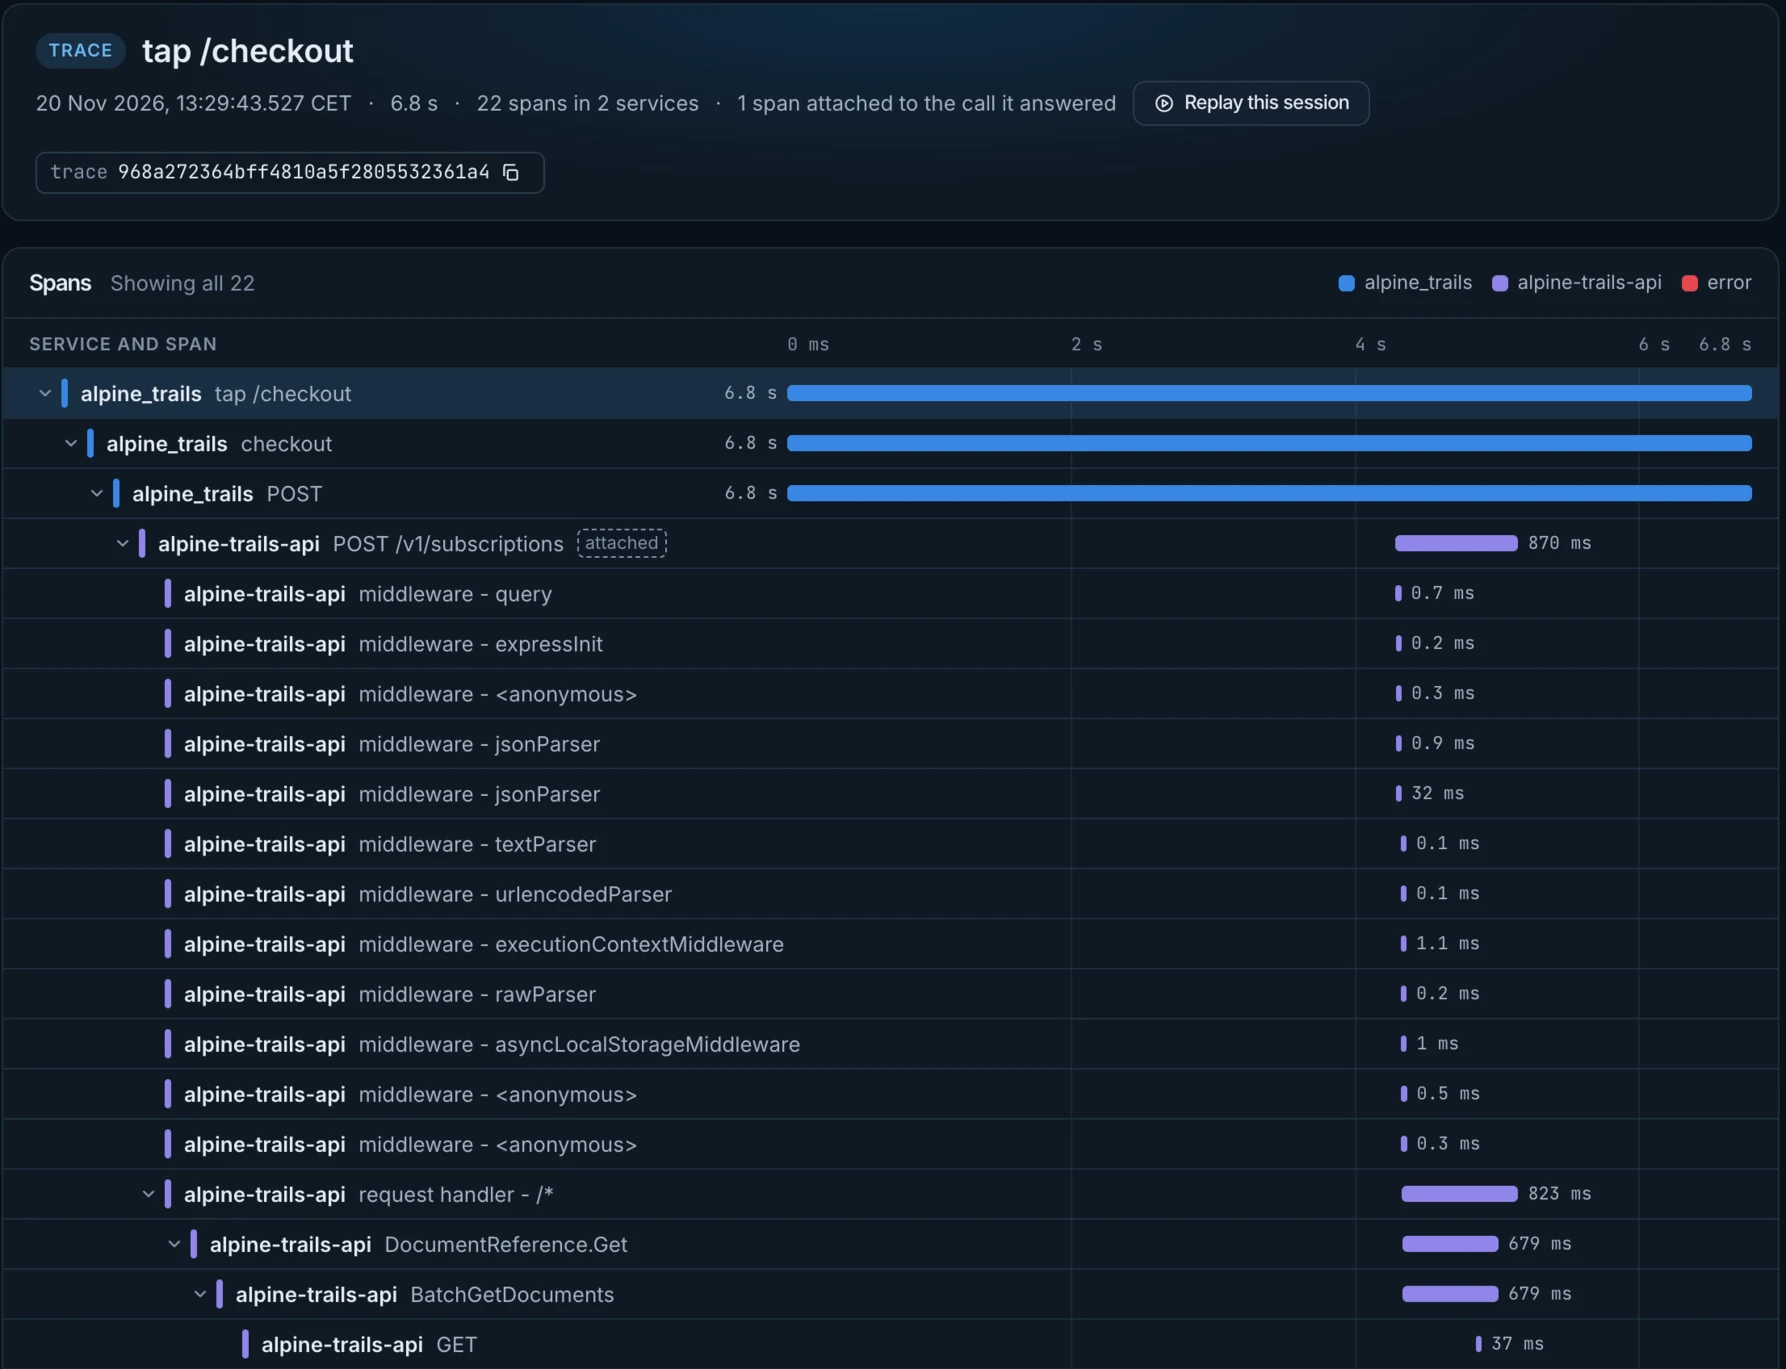
- Distributed tracing. Follow a call from a click all the way through every backend service it touches.
- RUM. Real user monitoring with session replay at five fidelity levels, from pixels to widget outlines.
- AI and MCP. Ask AI about your production telemetry from Observatory or your agents.
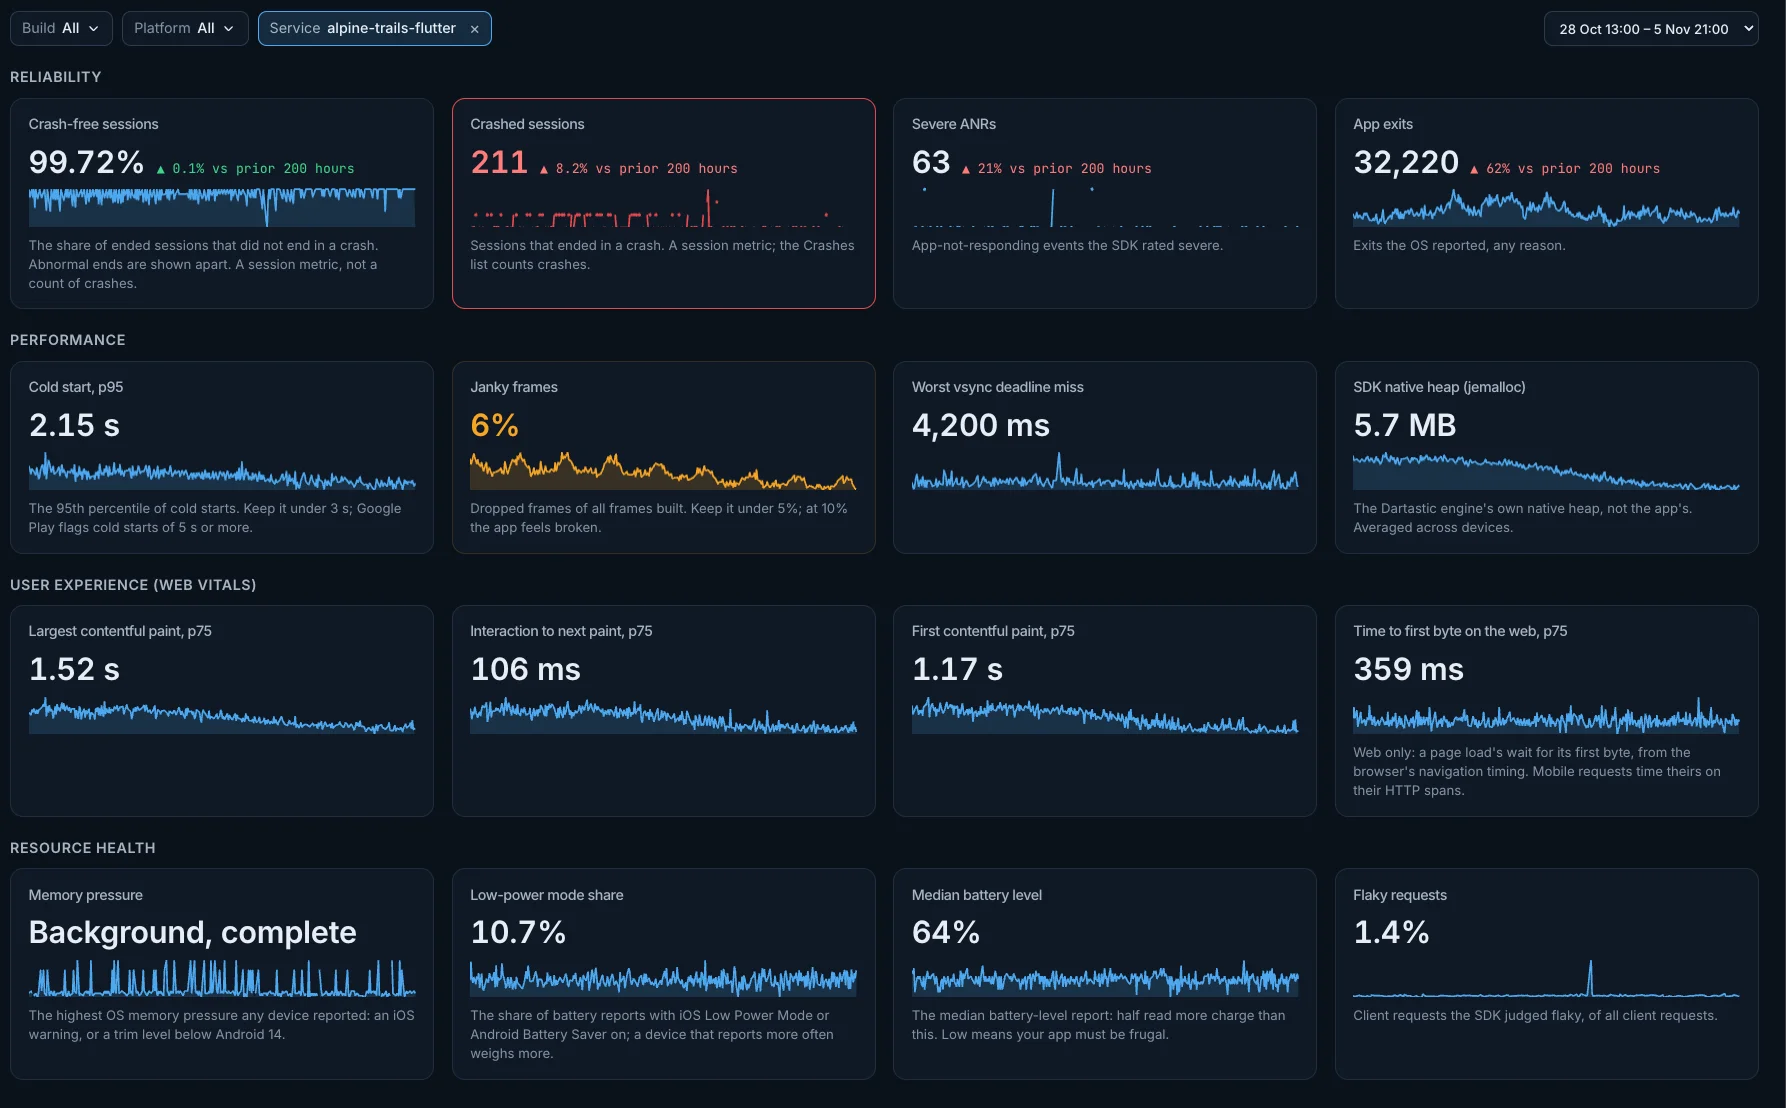
- Metrics. Page load times, janky widgets, battery drain, iOS MetricKit, Android Vitals, Web Vitals and more.
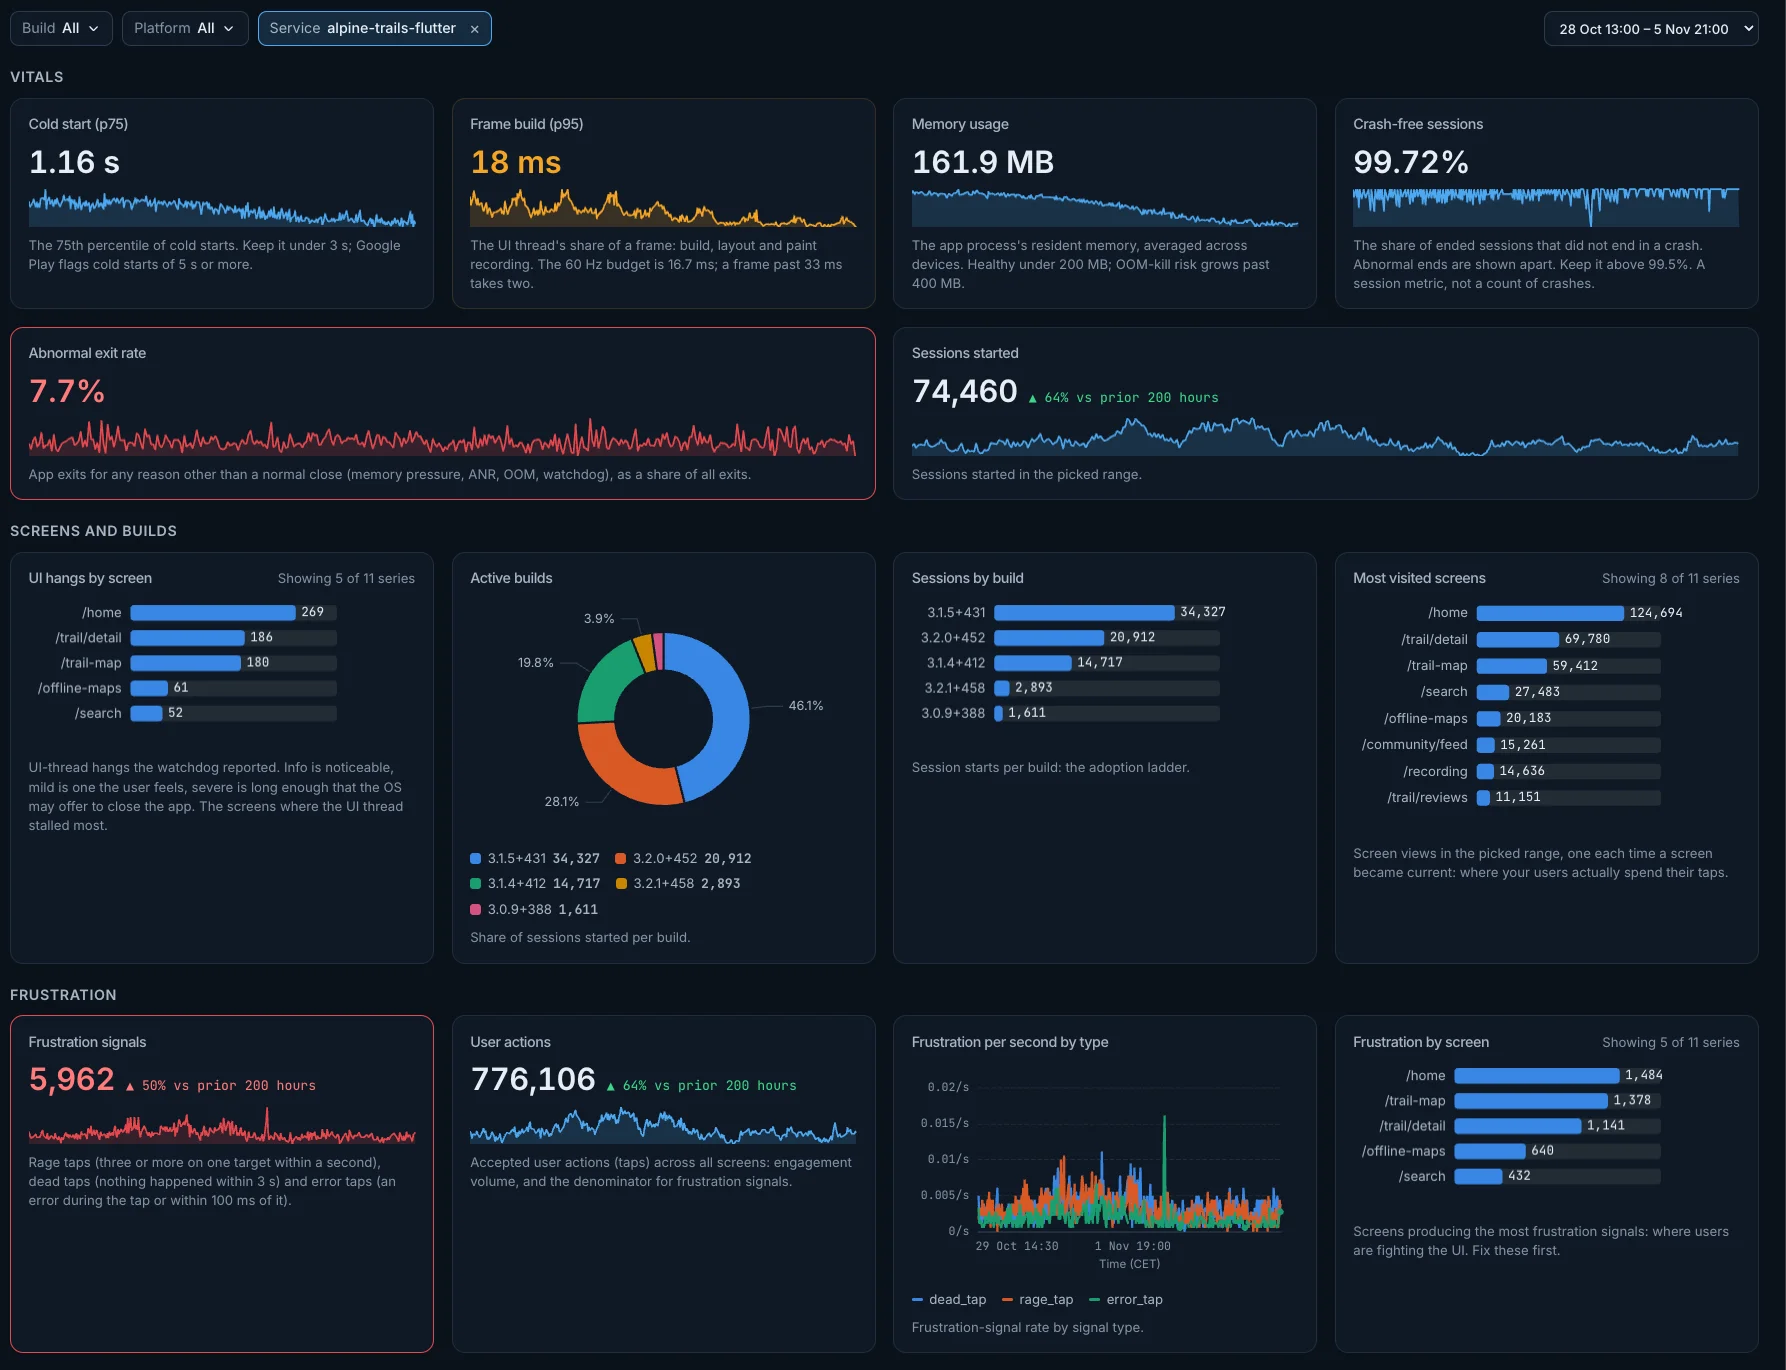
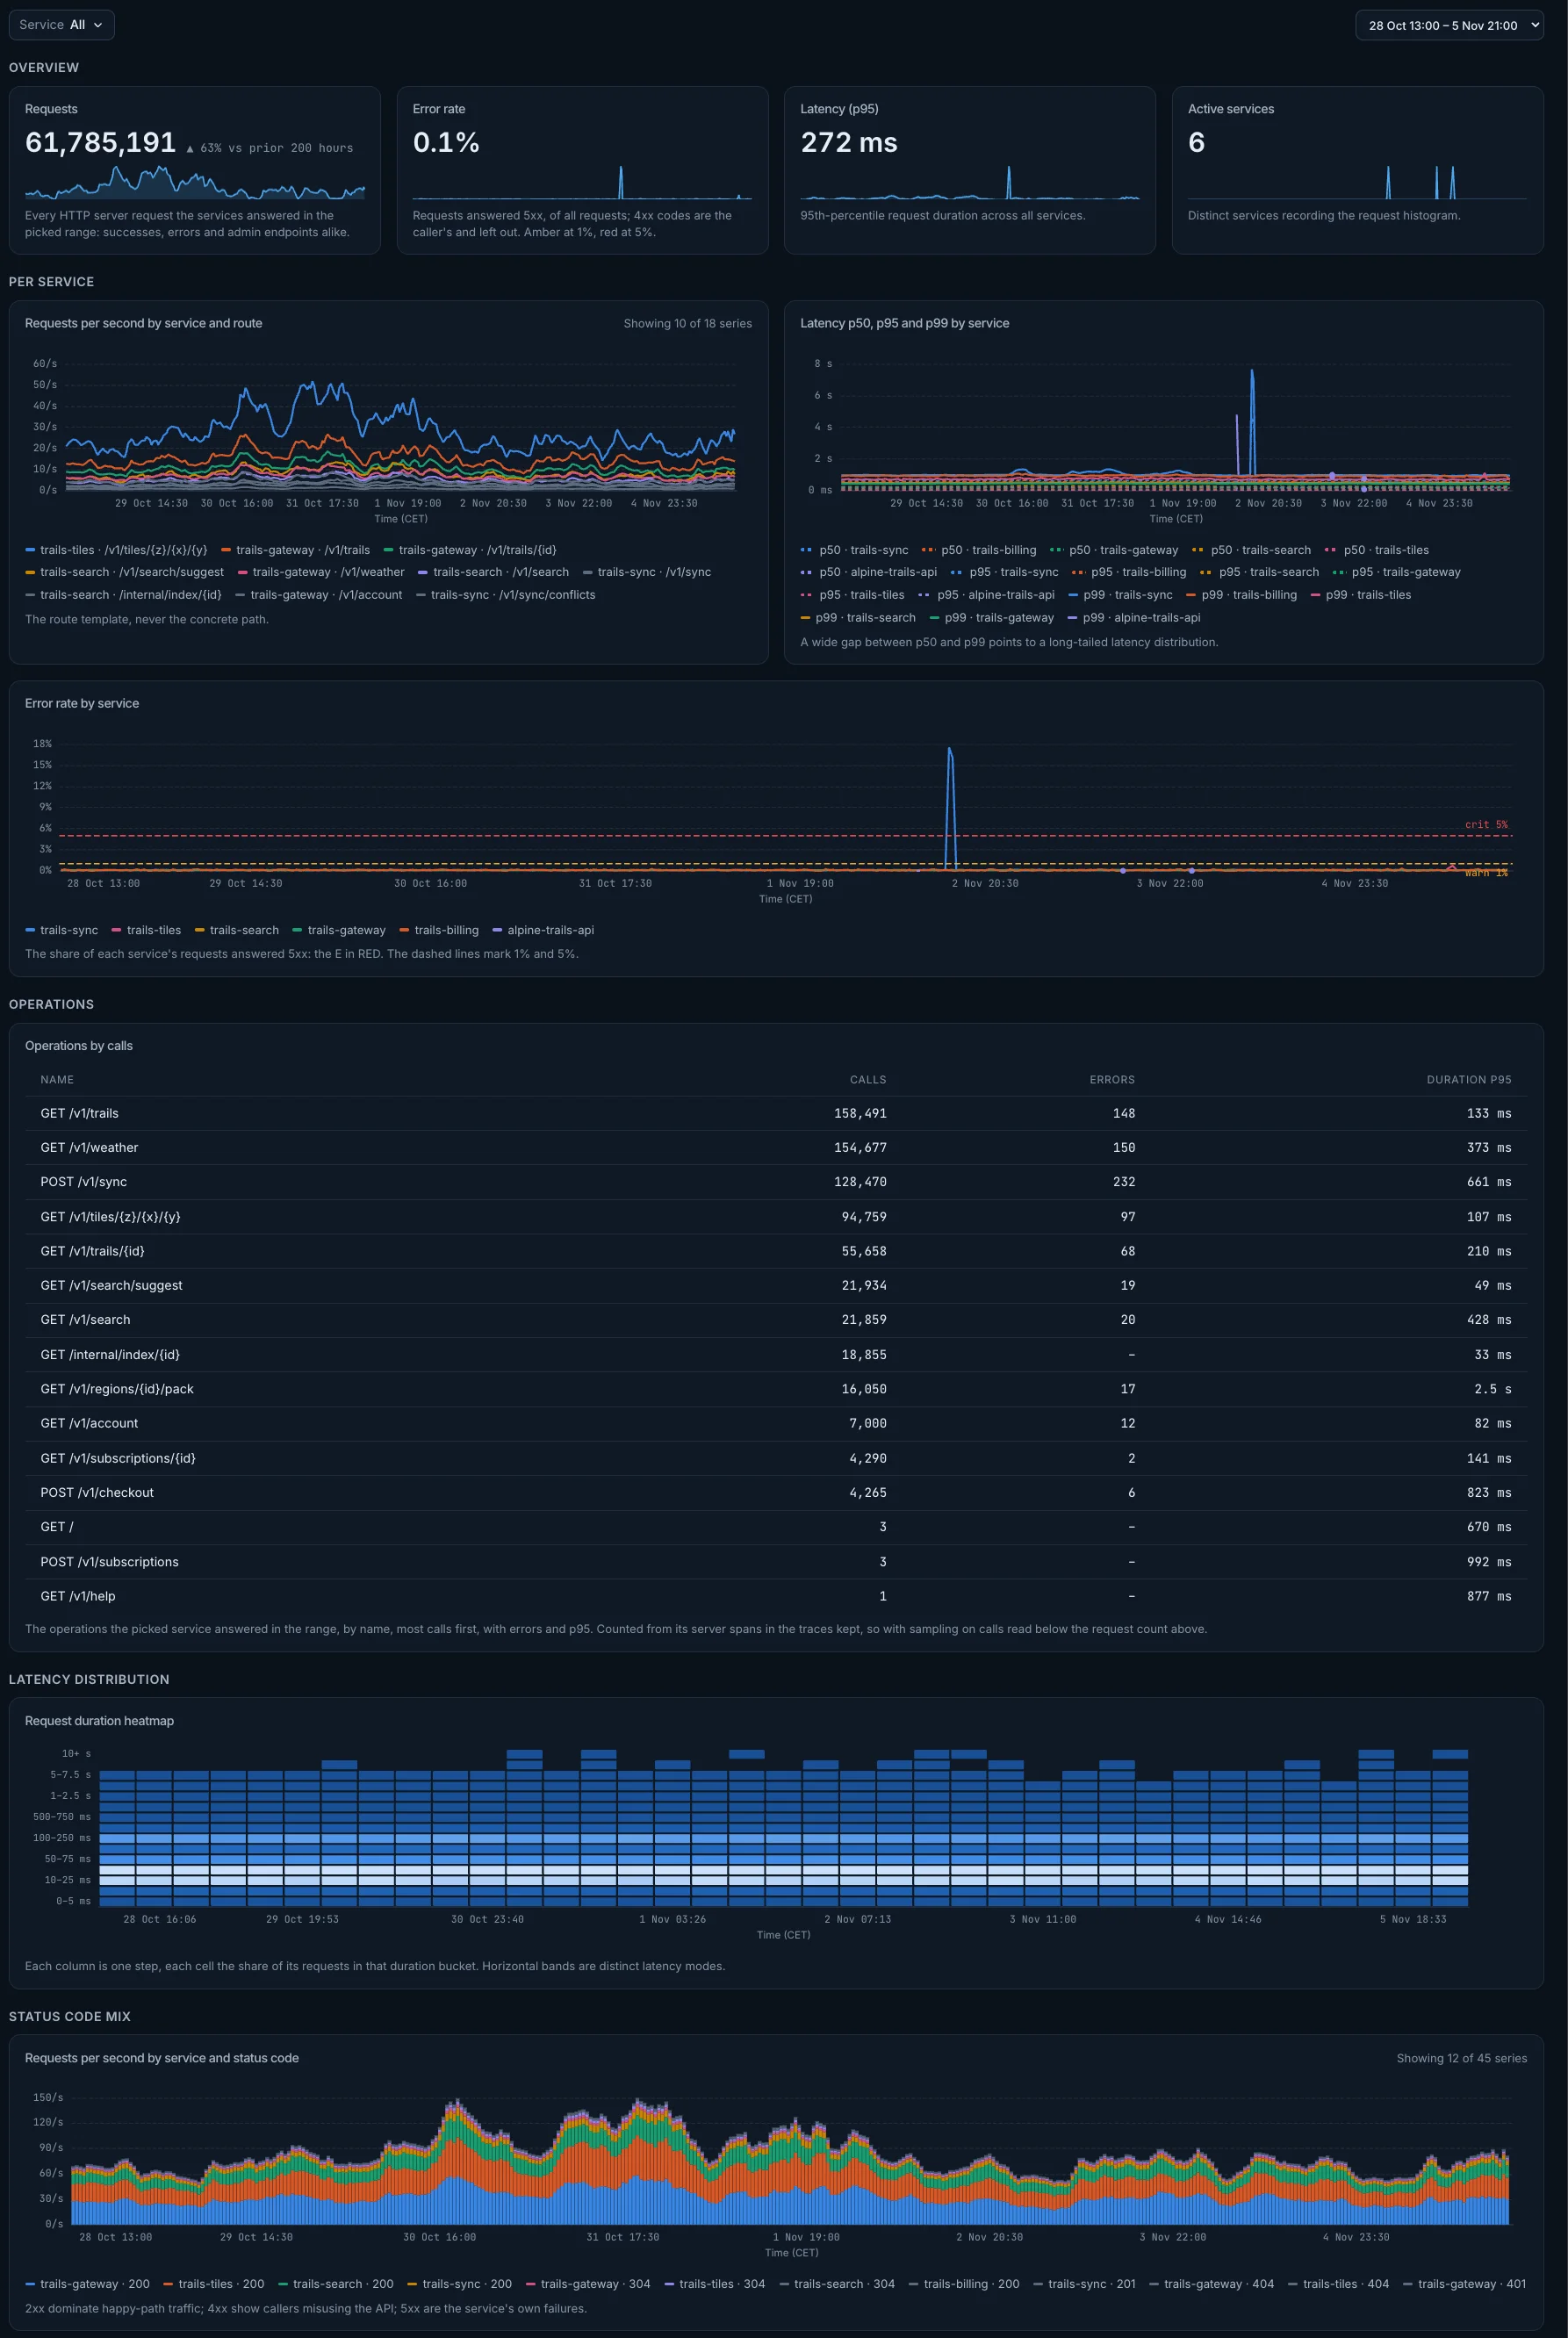
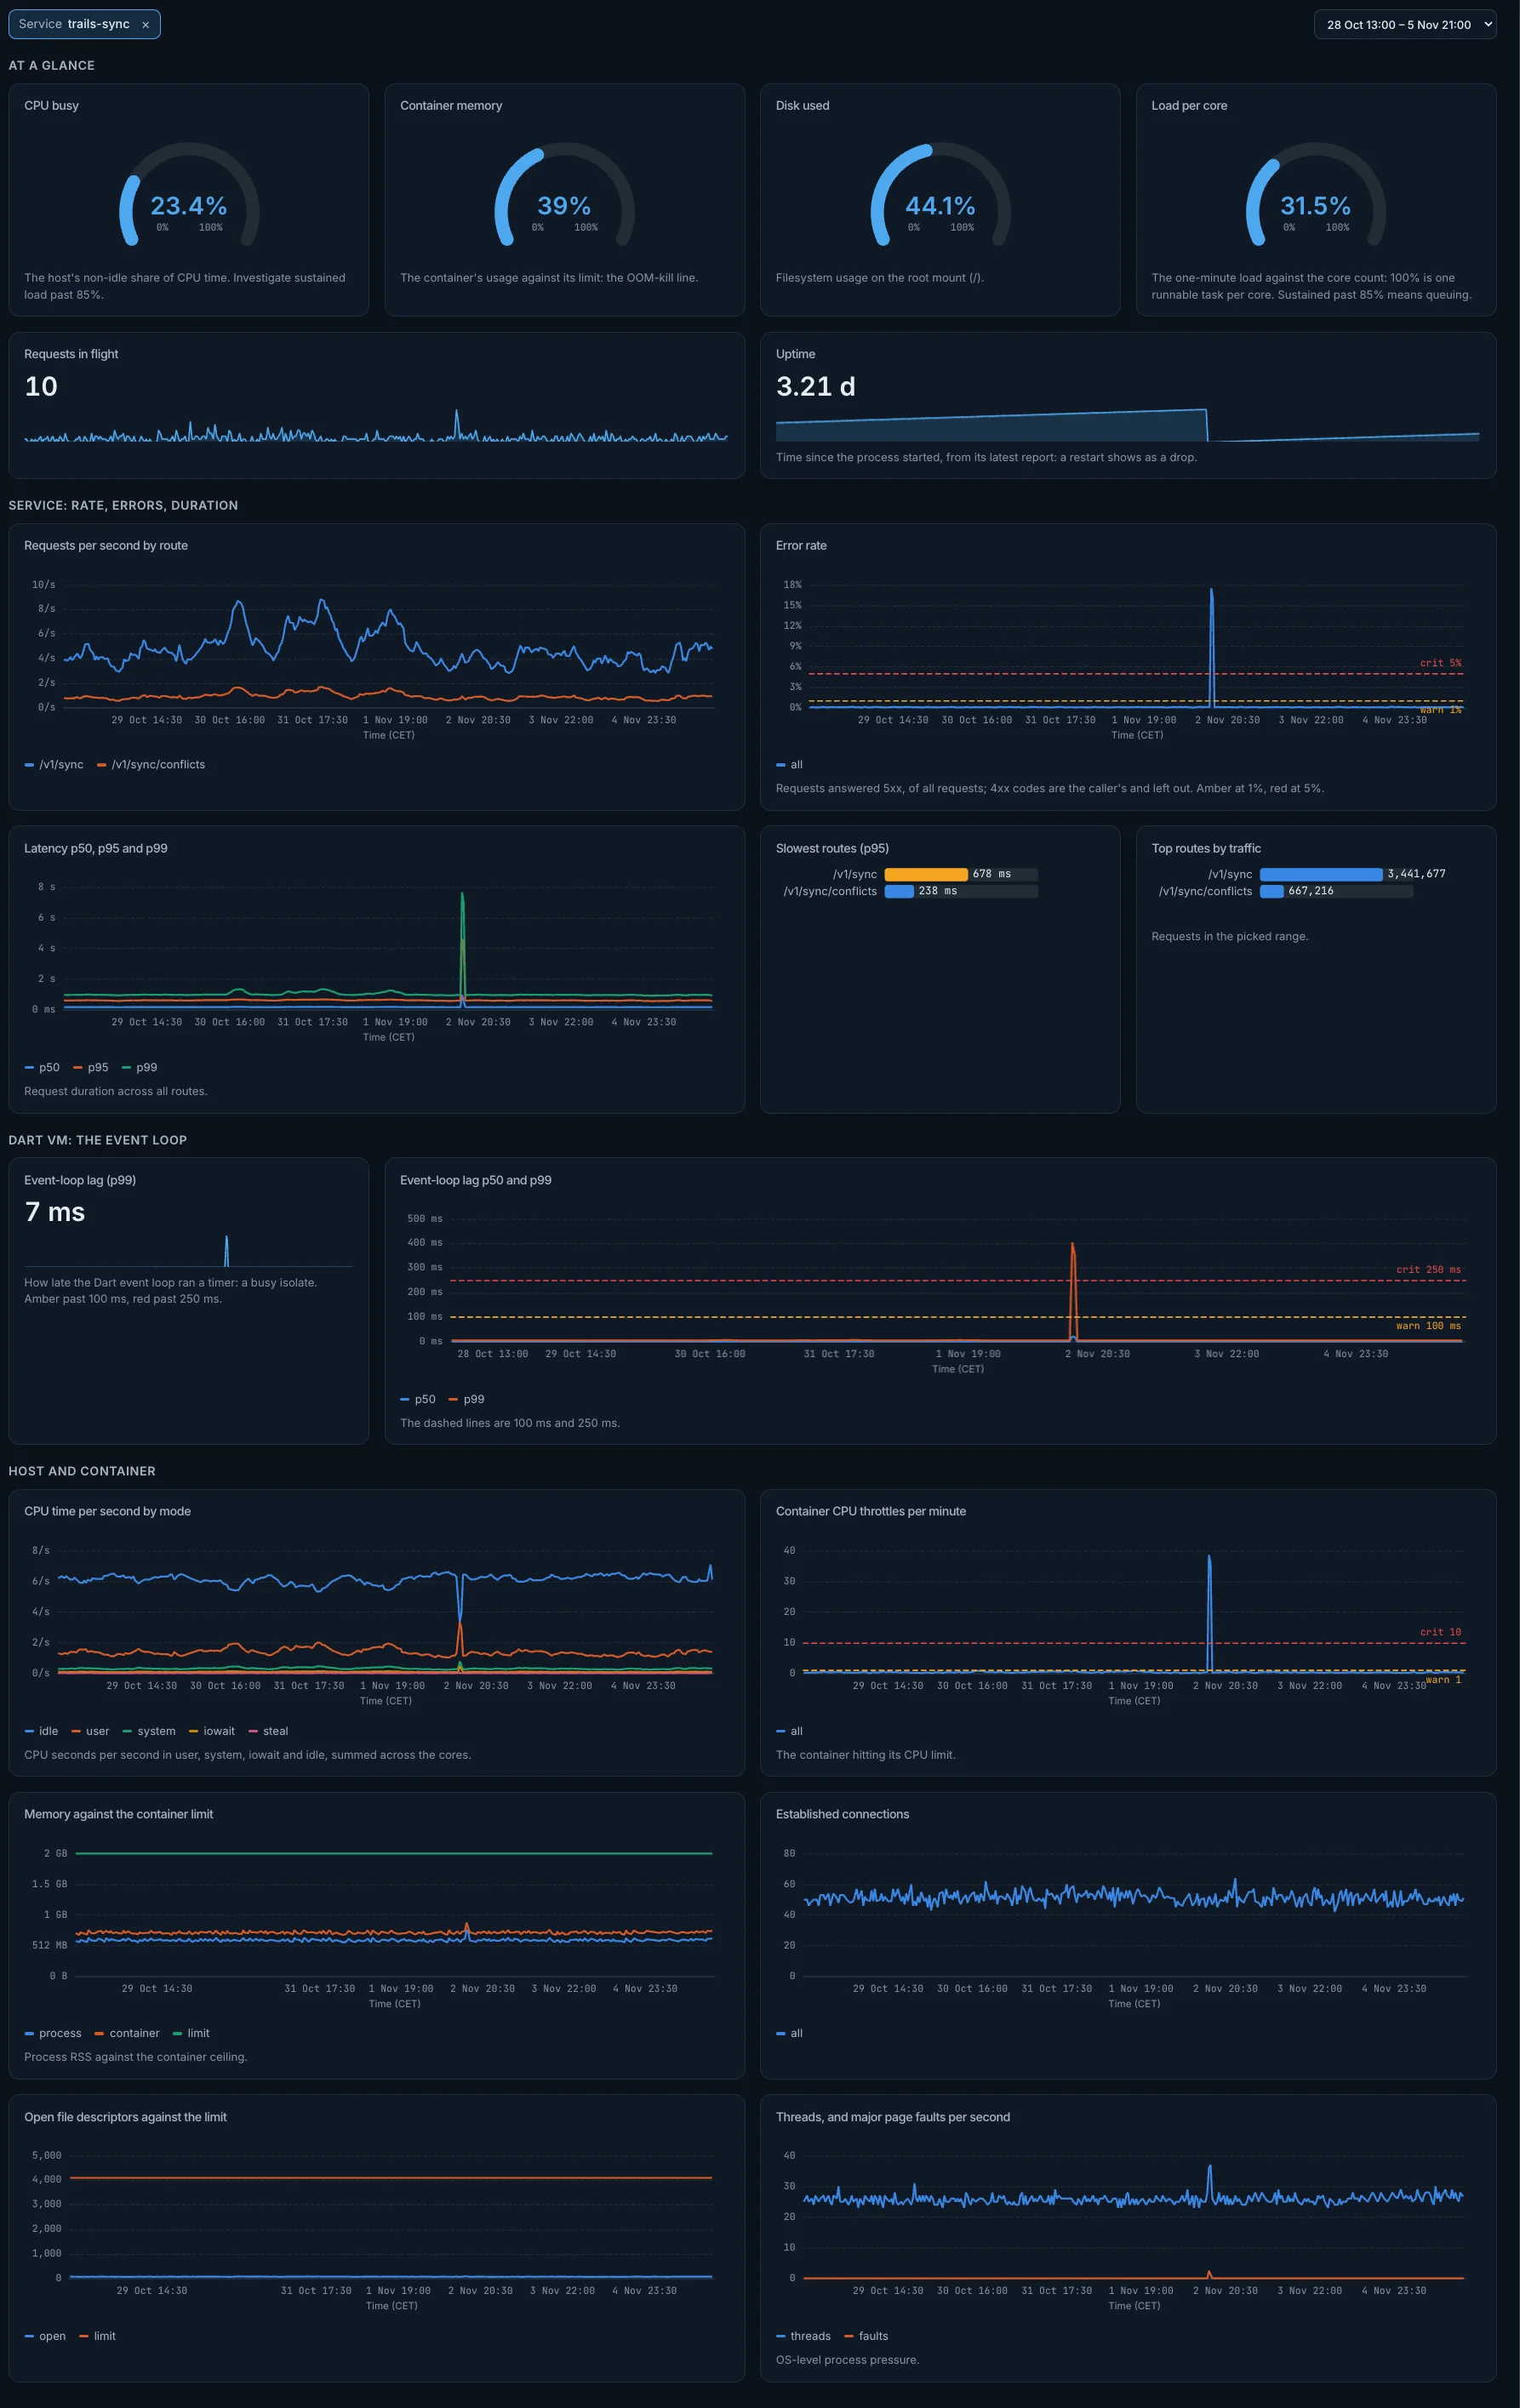
- Dashboards for Flutter apps and Dart servers: Fleet Health, Screen Usage, Crash Reports, Error Reports, Session Explorers and more.
- Alerts. Use Slack, email, Teams and more to stay on top of production.
- Includes Dartastic Native OTel Pro developer seats for your team.
Deployed Your Way
Three levels of isolation at price points from indie dev to enterprise.
Every Dartastic Observatory Includes
The same Flutter-first observability capabilities across Cloud, Dedicated, and Self-Hosted.
- Dartastic Native OTel Pro The most powerful OpenTelemetry engine on any platform.
- Dartastic RUM Replay real user sessions at five fidelity levels.
- Dartastic AI & MCP Use AI to ask questions about your telemetry. Plug the Dartastic MCP into your agents.
- Dartastic Symbolizer Get source-code lines for production errors, right in Observatory.
- Dartastic Pub Your private package registry on shared infrastructure.
Dartastic Observatory ingests OTel from any source: web apps, Go microservices, Node servers, nginx, Java monoliths, anything that generates OTel. See distributed traces through your entire stack, connected with logs and metrics.
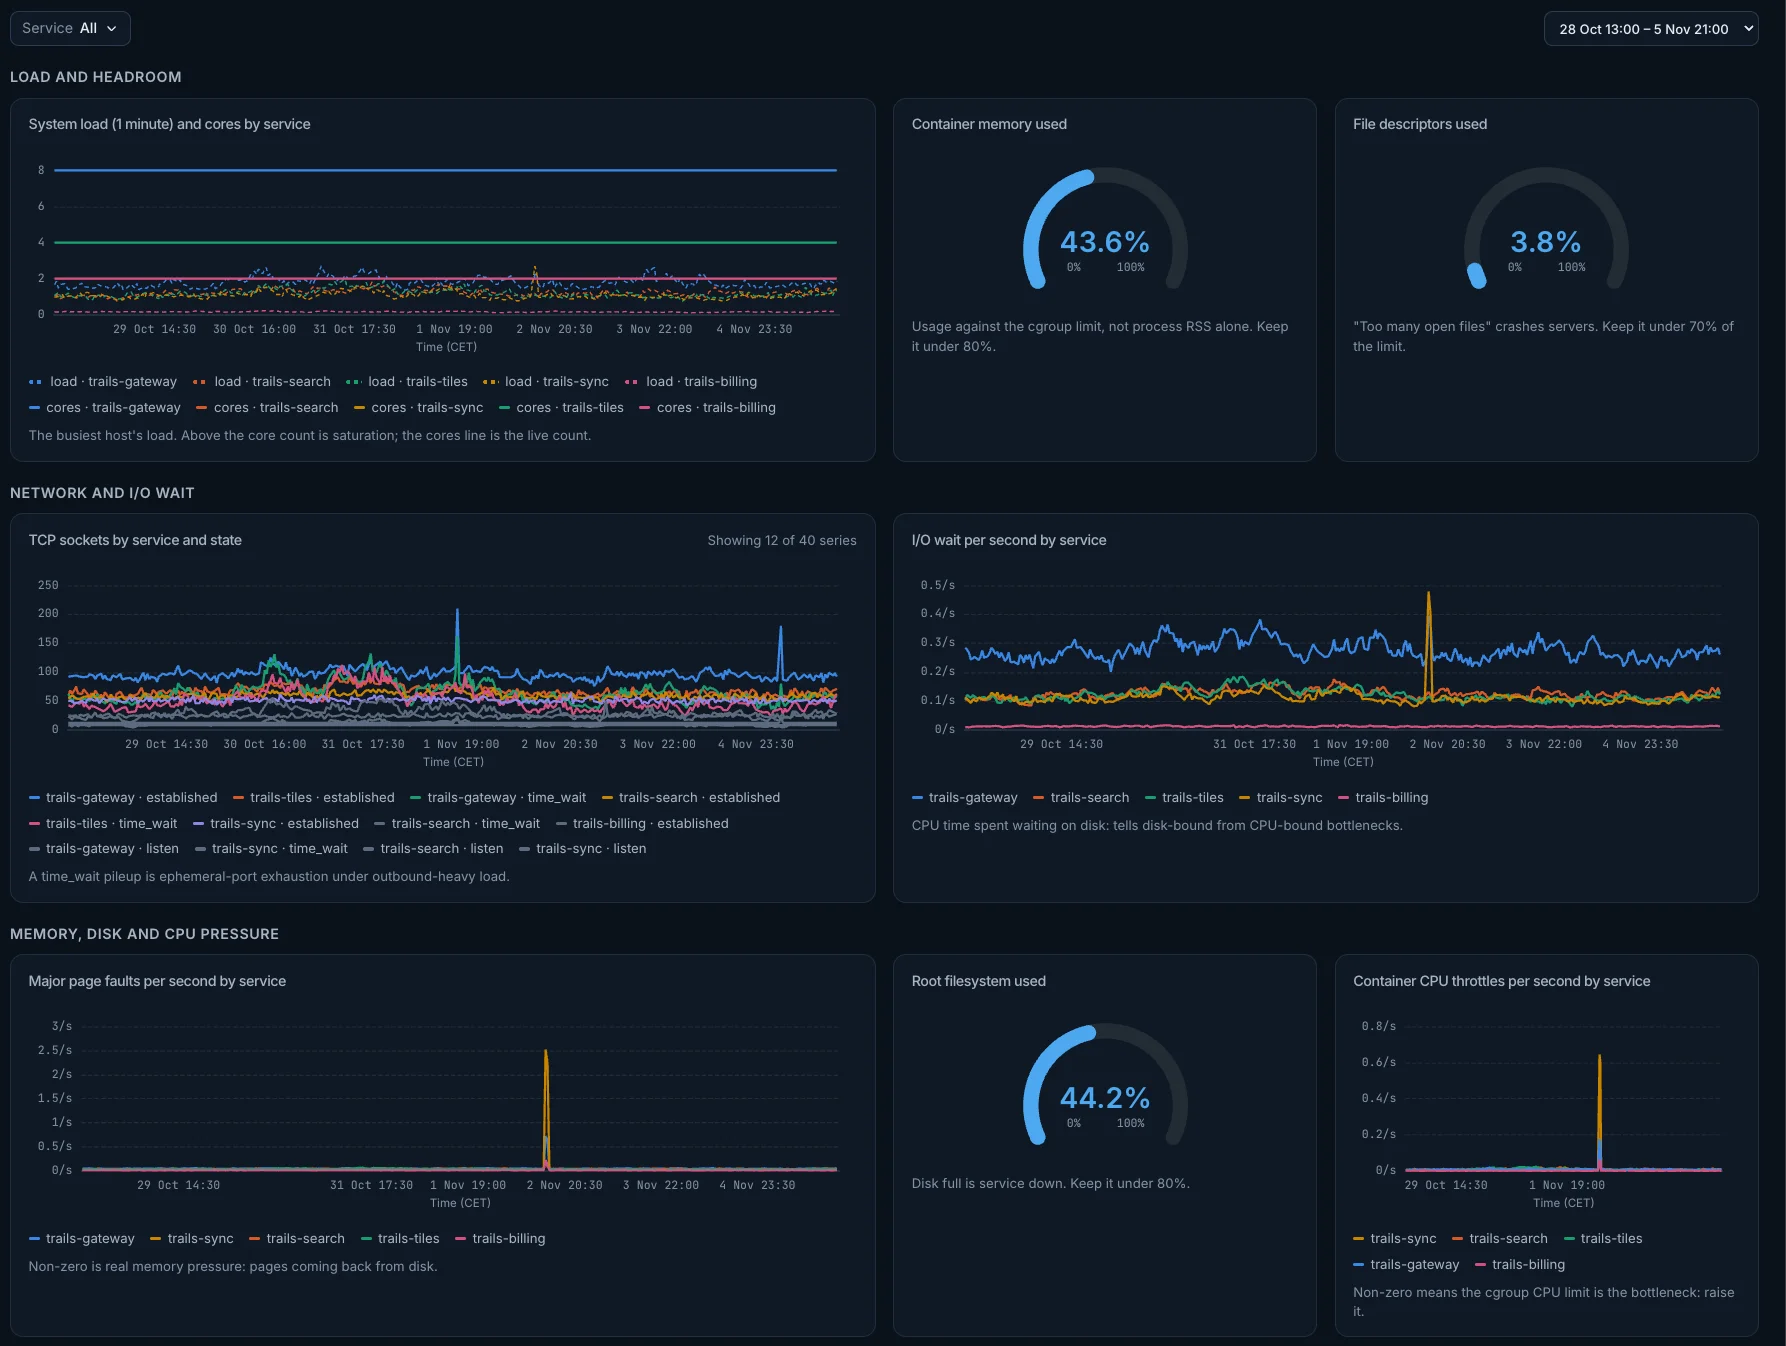
Dashboards
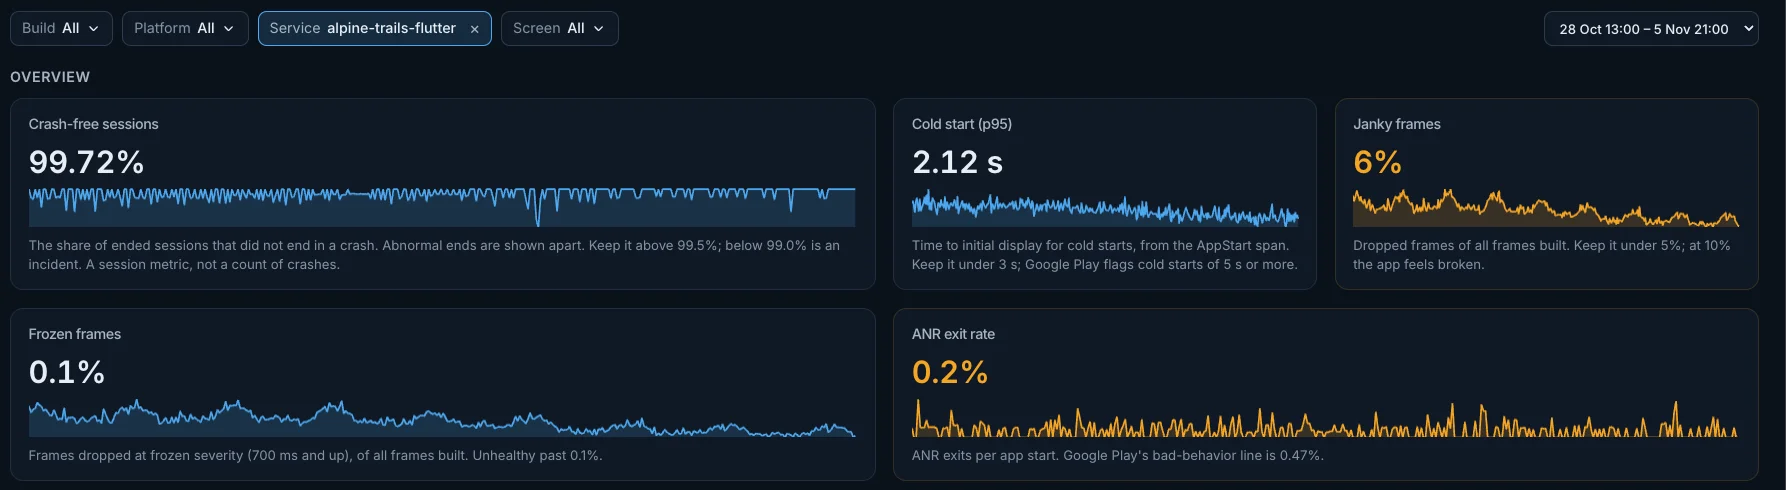
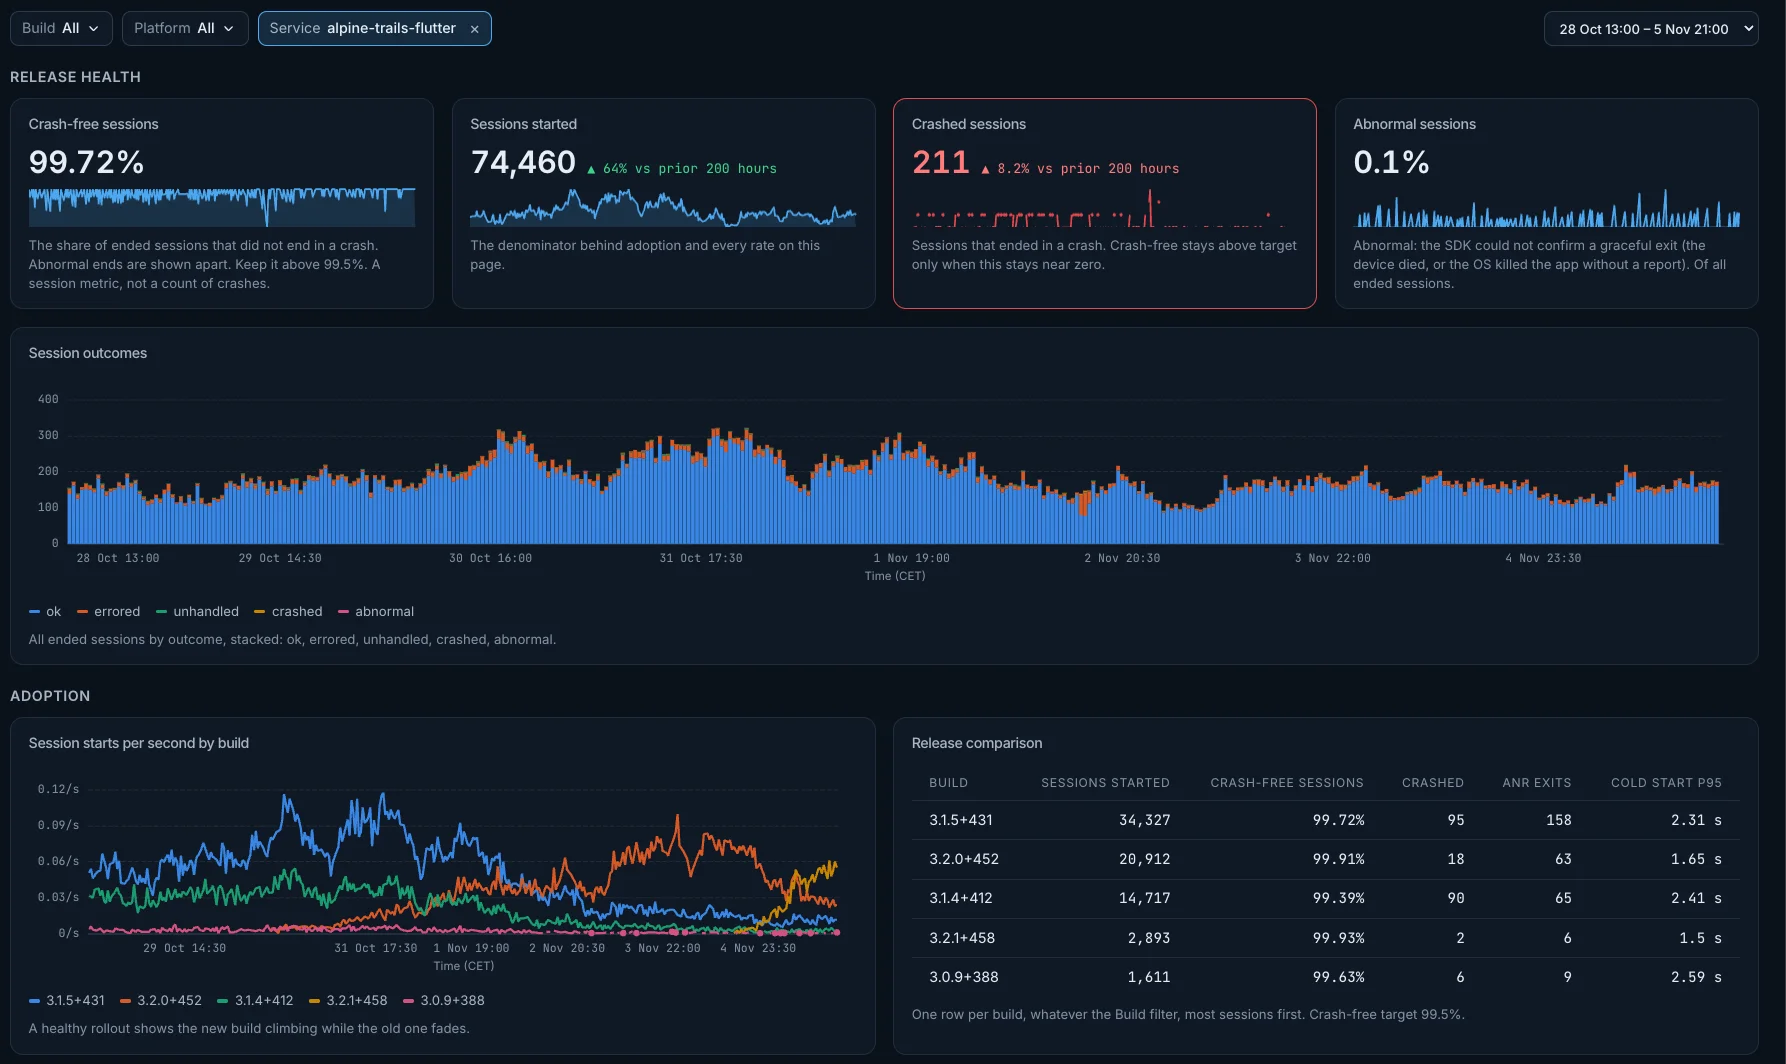
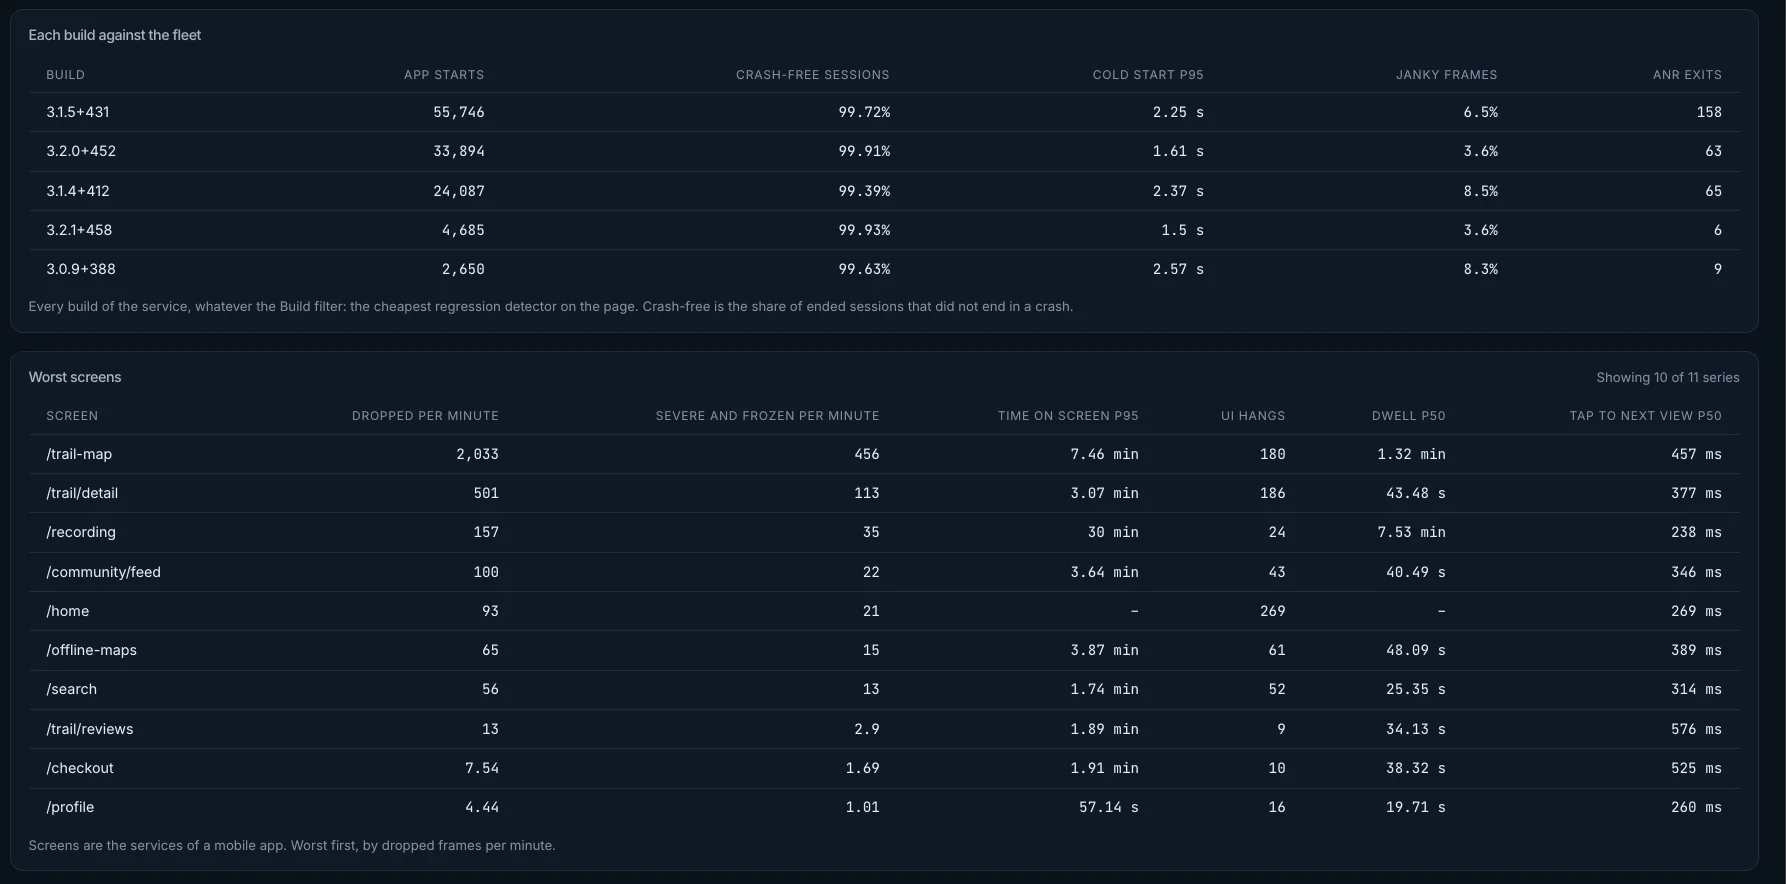
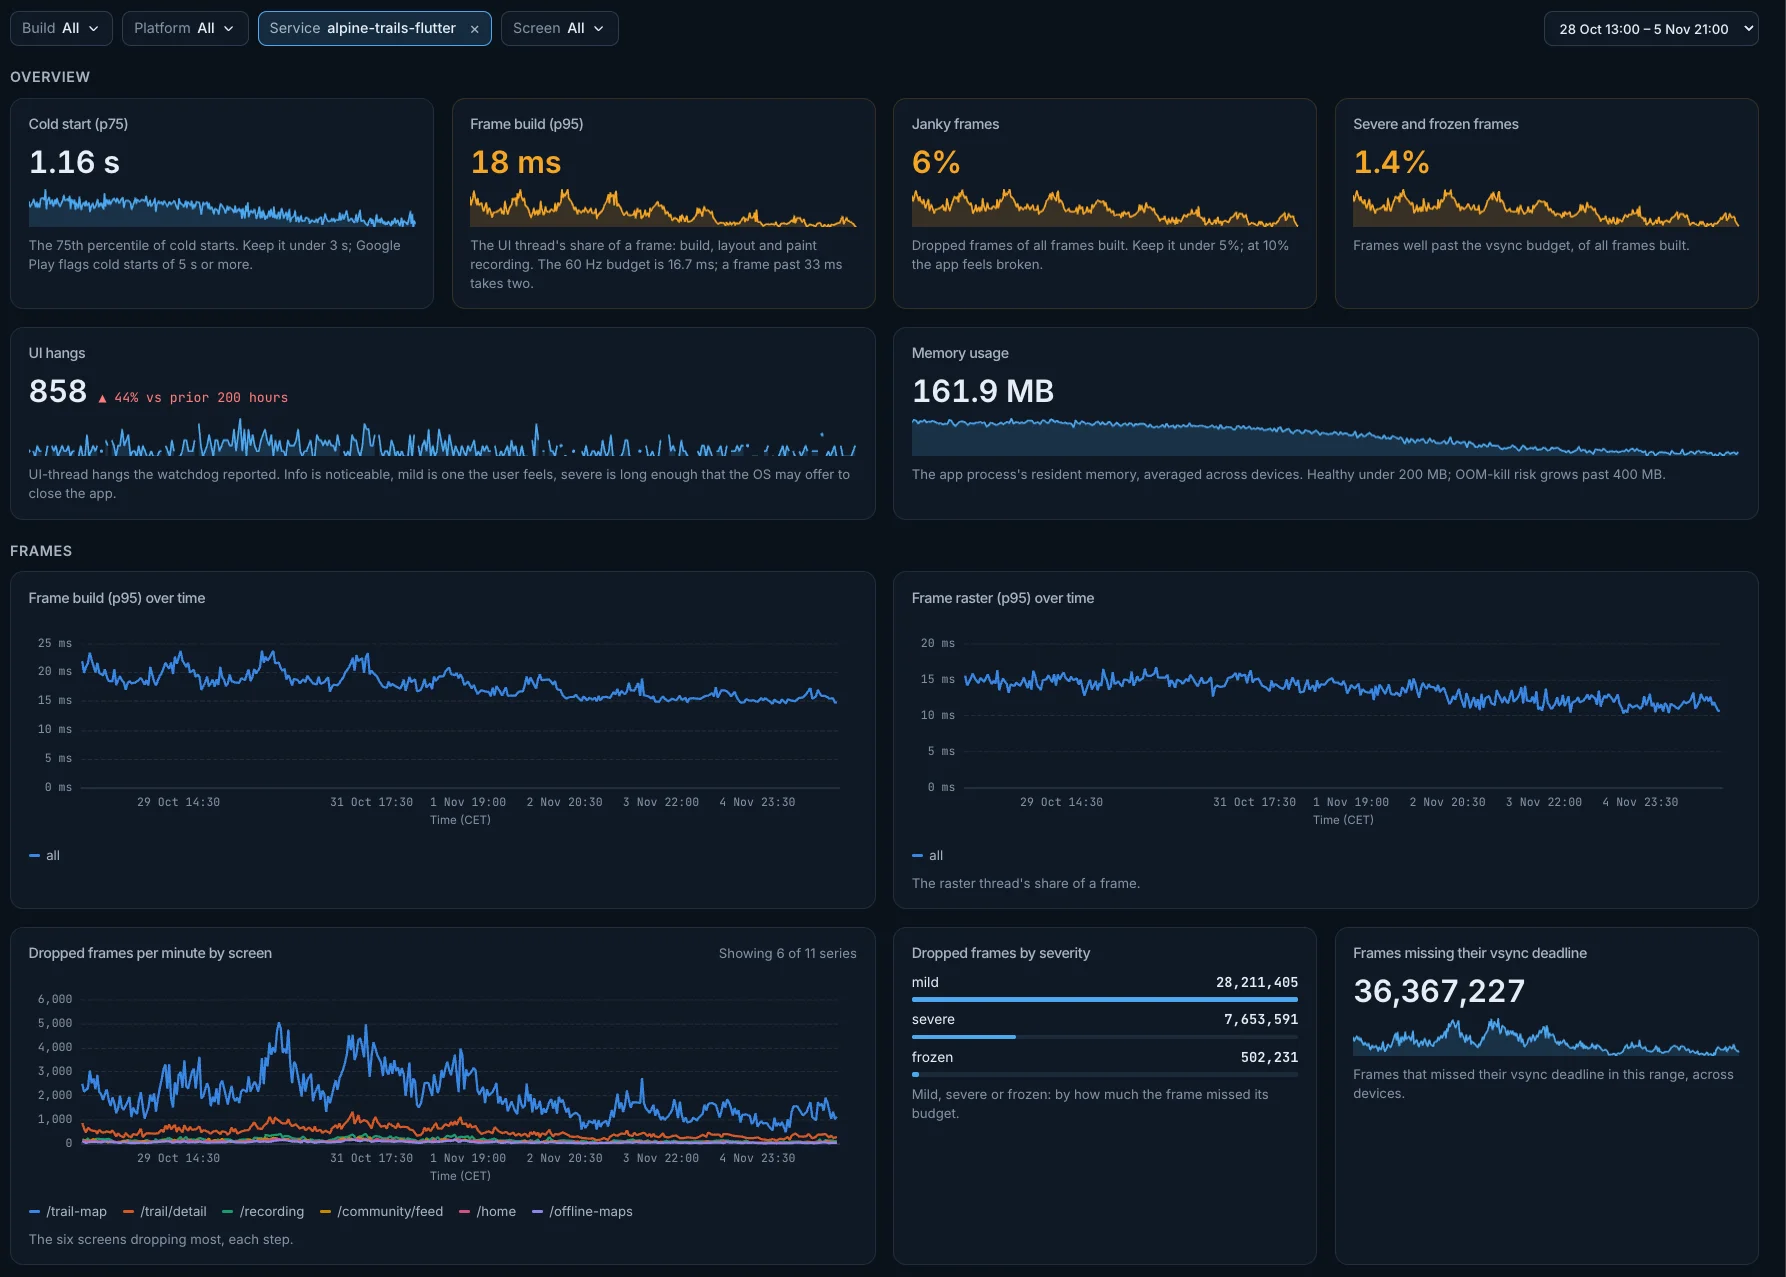
Flutter App Health
- Cold startup p50 / p95
- Frame build vs raster times, jank ratio
- Top janky routes, frozen frames
- Navigation durations
- Dart heap and GC frequency
Mobile Release Health
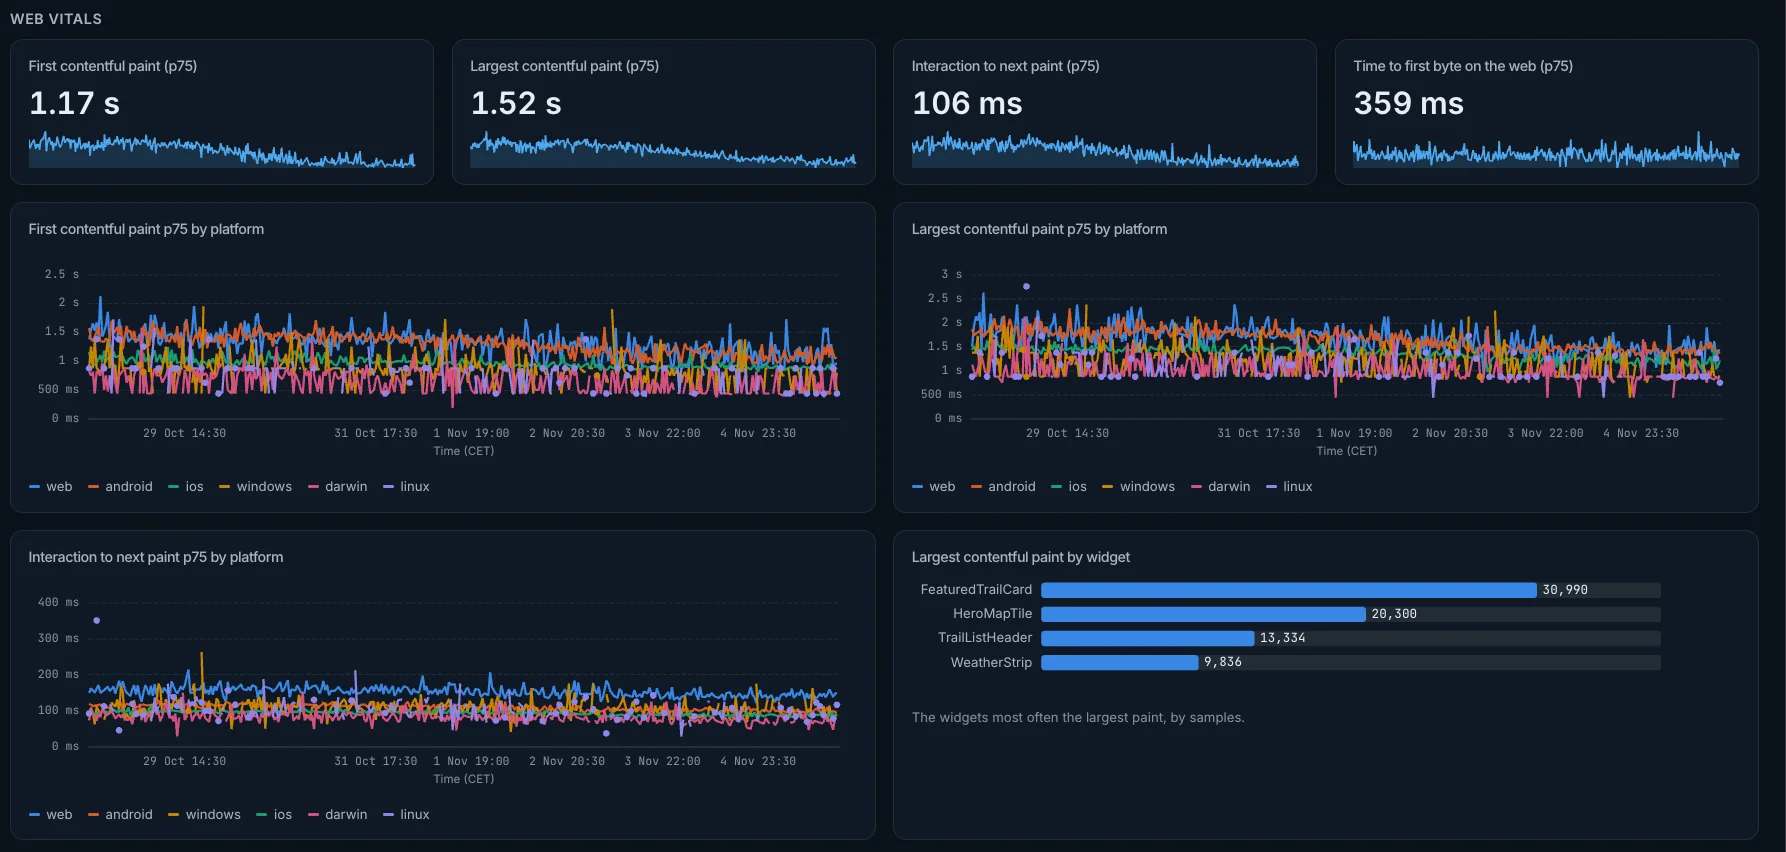
- Web Vitals for mobile: LCP, INP, FCP, TTFB p75
- App exits: OOMs and ANRs, per release
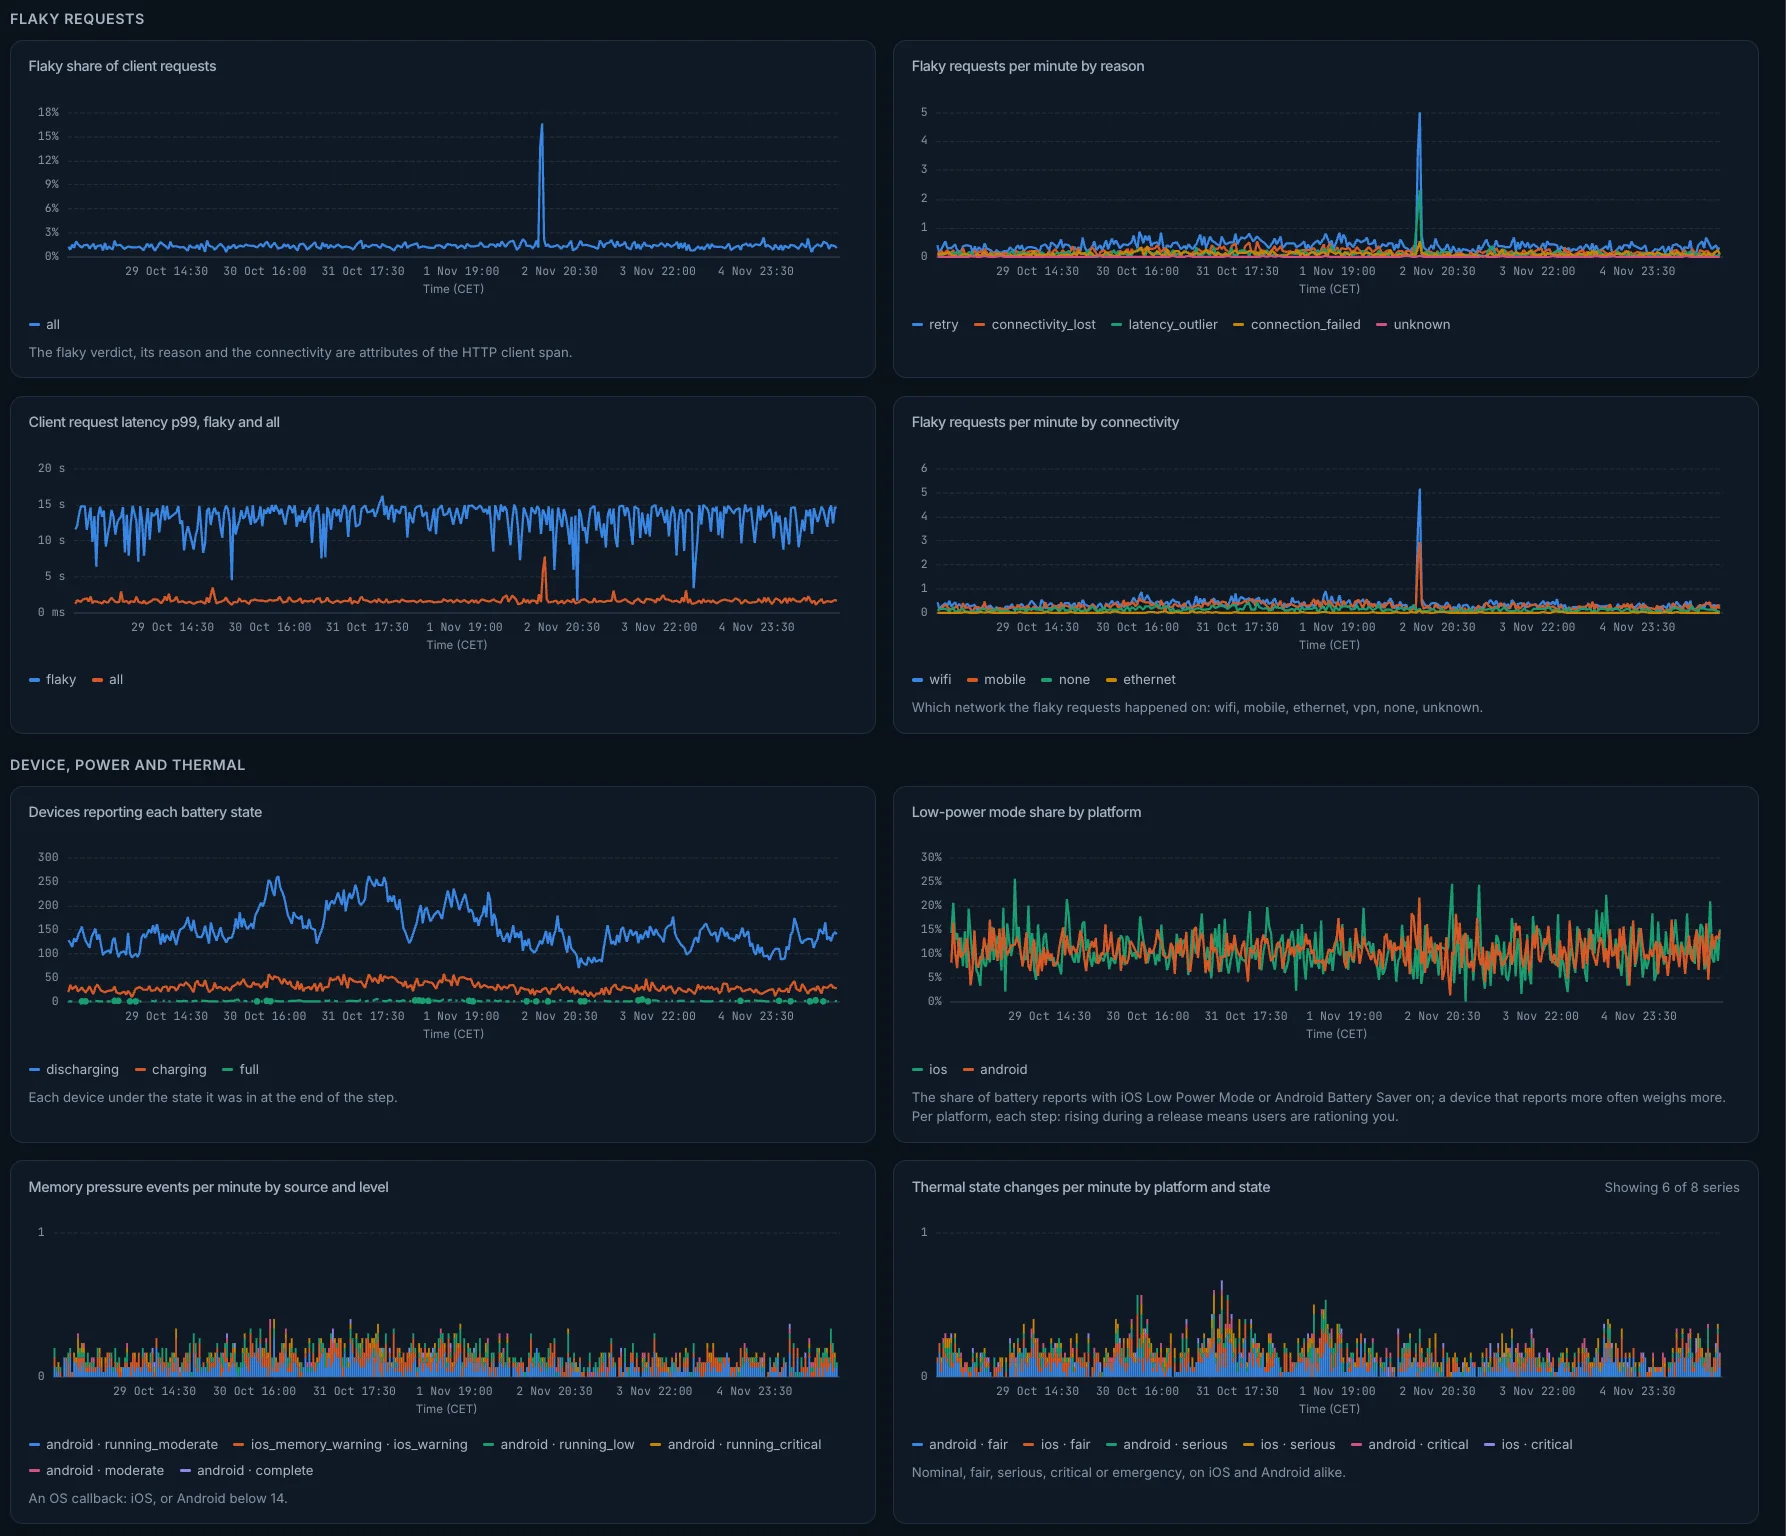
- Flaky-request rate and reasons
- Memory pressure, battery, low-power share
- iOS thermal state
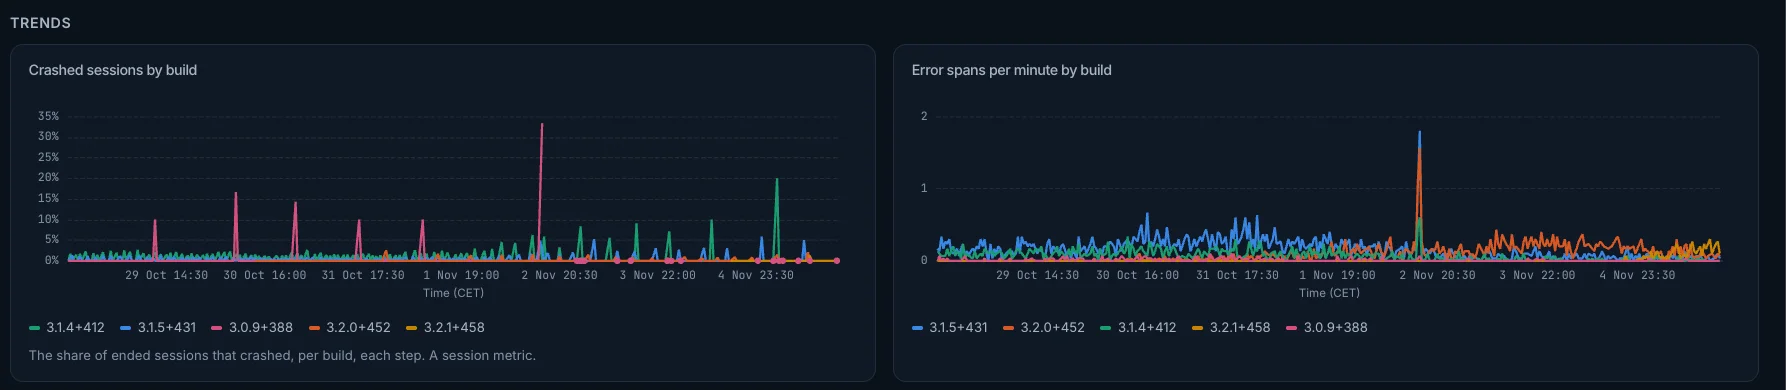
Crashes, Symbolized
- Production crashes with the trace that caused them
- One click from obfuscated frames to source lines
- Symbols resolved where your data lives
YOUR INFRASTRUCTURE
Dartastic Self-Hosted Observatory
Lives on your network. The whole platform installs inside your own cluster on AWS, GCP, Azure or on-prem: Dartastic Observatory, Dartastic RUM, your private Dartastic Pub registry, Dartastic Symbolizer, and your own private control plane. It has no dependency on Dartastic Cloud or dartastic.io.
Air-gapped, when your devices are too. When your apps run on devices inside your network, nothing crosses the boundary except our signed bundles you carry in.
One public endpoint for apps on the app stores. Apps on the App Store and Google Play run on phones outside your network, so they need one way in. Expose only your OTel ingest endpoint, which checks every token and accepts nothing but telemetry. Everything else stays air-gapped: Observatory, Control Room, Pub and Symbolizer stay off the internet.
- Unlimited sessions at every RUM fidelity, unlimited ingest and retention, and at least 250 Dartastic Native OTel Pro developer seats.
- Your cluster, your keys, your control plane. No outbound connection to Dartastic, ever.
- Updates, licenses and packages arrive as signed bundles, through your own approved transfer process, on your own schedule.
- Outbound traffic is denied by default. Every exception is on a short, disclosed list you can turn off, and you can verify it yourself.
- Dartastic AI with your own model key, your cloud provider's AI, or a local model that keeps every question inside your network.
- Enterprise ready: secure deployment, audits, SBOMs and your own SSO.
- We give you a Helm chart and you configure it to fit your cluster.
- Dartastic Pub Enterprise with an offline mirror of public packages, and Dartastic Symbolizer.
- Business support included, delivered without remote access.
SHARED OBSERVABILITY
Dartastic Cloud Observatory
Start fast, nothing to provision. Shared, hard-isolated infrastructure with four meters you can see: sessions, ingress, egress and Symbolizer.
- No platform to provision. Subscribe, mint an ingest key, point your exporter, and telemetry flows. Nothing to wait on.
- One pool for your data. Spans, logs, metrics and replays all count toward one ingress allowance. We keep it simple.
- RUM at all 5 fidelity levels and text occlusion variations. Every captured session can be replayed.
- Dartastic AI. Ask questions about your telemetry. Cloud Pixel and Cloud Standard have daily, weekly and monthly limits, and Cloud Pro has 4x Cloud Standard's. To maximize safety on shared infrastructure, we currently only offer Anthropic models on Cloud Observatory.Cloud Free has limited use.
- Hard multi-tenant isolation. Your data is structurally separated from every other tenant and stamped at the edge from your signed key, never trusted from the client.
- Grow into your own platform. When you outgrow Cloud, move up to Dedicated or Self-Hosted for a platform of your own. Your instrumentation comes with you.
- Customized for Dart and Flutter: Fleet Health, mobile metrics, and slow-widget identification.
- Dartastic Symbolizer shows source-code lines for production errors, right in your dashboards.
- Dartastic Pub included. A private package registry on shared infrastructure.
- Dartastic Native OTel Pro. 2 developer seats with Cloud Pixel, 3 with Cloud Standard and 10 with Cloud Pro.Developer seats with Cloud Free: 1.
How Cloud pricing works
- $0 / month, Cloud Free. 10,000 sessions, 10 GB of ingress, 100 GB of egress and 5,000 symbolizations a month.
- $25 / month, Cloud Standard. 100,000 sessions, 100 GB of ingress, 500 GB of egress and 25,000 symbolizations a month.
- $100 / month, Cloud Pro. 1,000,000 sessions, 500 GB of ingress, 1,000 GB of egress and 100,000 symbolizations a month.
- Four meters you can see. Sessions, ingress, egress and Symbolizer. A session costs the same at every replay level; a higher level costs more only through the data it stores.
- Past what your plan includes. Sessions $0.75 per 1,000, ingress $0.40 per GB, egress $0.03 per GB, Symbolizer $0.25 per 1,000, billed with the next month's bill.Cloud Free takes no card, and each of its meters stops at what the plan includes.
- Retention. Cloud Pixel keeps metrics for 7 days and traces and logs for 3. Cloud Standard keeps metrics for 15 days and traces and logs for 7. Cloud Pro keeps metrics for 30 days and traces and logs for 14.Cloud Free keeps what Cloud Pixel keeps.
Start on Dartastic Cloud
Billed by the month. Cancel anytime.
PRIVATE OBSERVABILITY
Dartastic Dedicated Observatory
A dedicated platform, with unlimited seats. One tier price that includes sessions, ingress, egress and symbolizations every month.
- One customer, one platform. Nothing is multi-tenant. Your telemetry, symbols, and private packages never share a process, disk, or database with another customer.
- Live in minutes. Subscribe, pick your subdomain, and your platform auto-provisions at
<slug>.dartastic.io, with TLS, usually in 5 to 15 minutes. - Your data stays yours. It lives on your platform, exportable any time, with hourly retention-locked backups even root cannot destroy.
- Customized for Dart and Flutter: Fleet Health, mobile metrics and slow-widget identification. Tools that fit.
- Dartastic Pub Your own private pub isolated on your own platform.
- Dartastic Symbolizer Your own symbolization instance in your own platform.
- Dartastic Native OTel Pro The most powerful client OpenTelemetry engine.
Subscribe to spin up your platform
Subscribe to Dedicated and pick your subdomain name. Your platform is ready in 5 to 15 minutes.
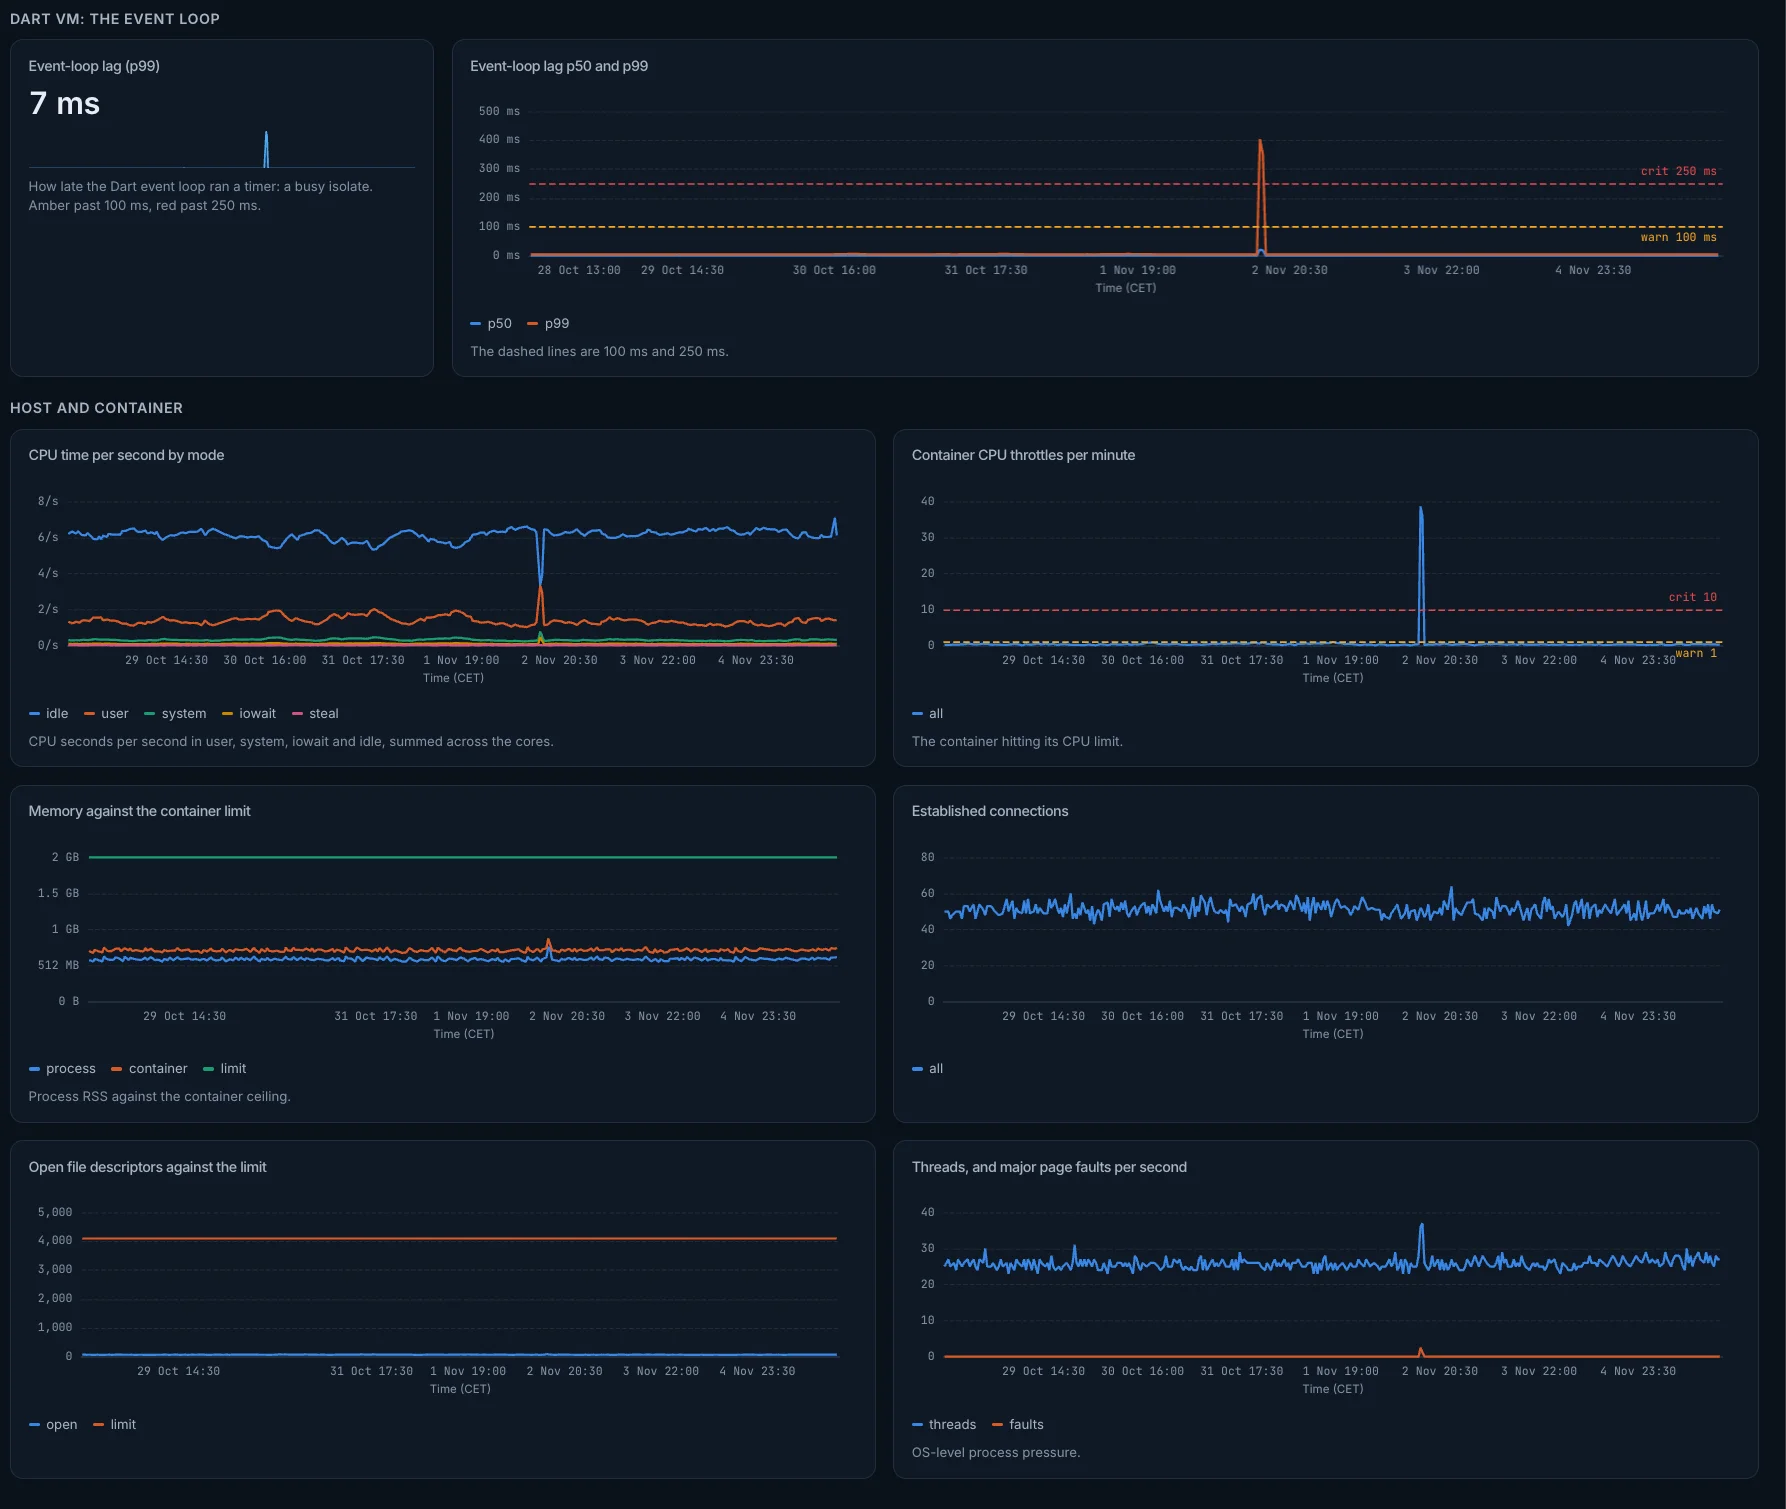
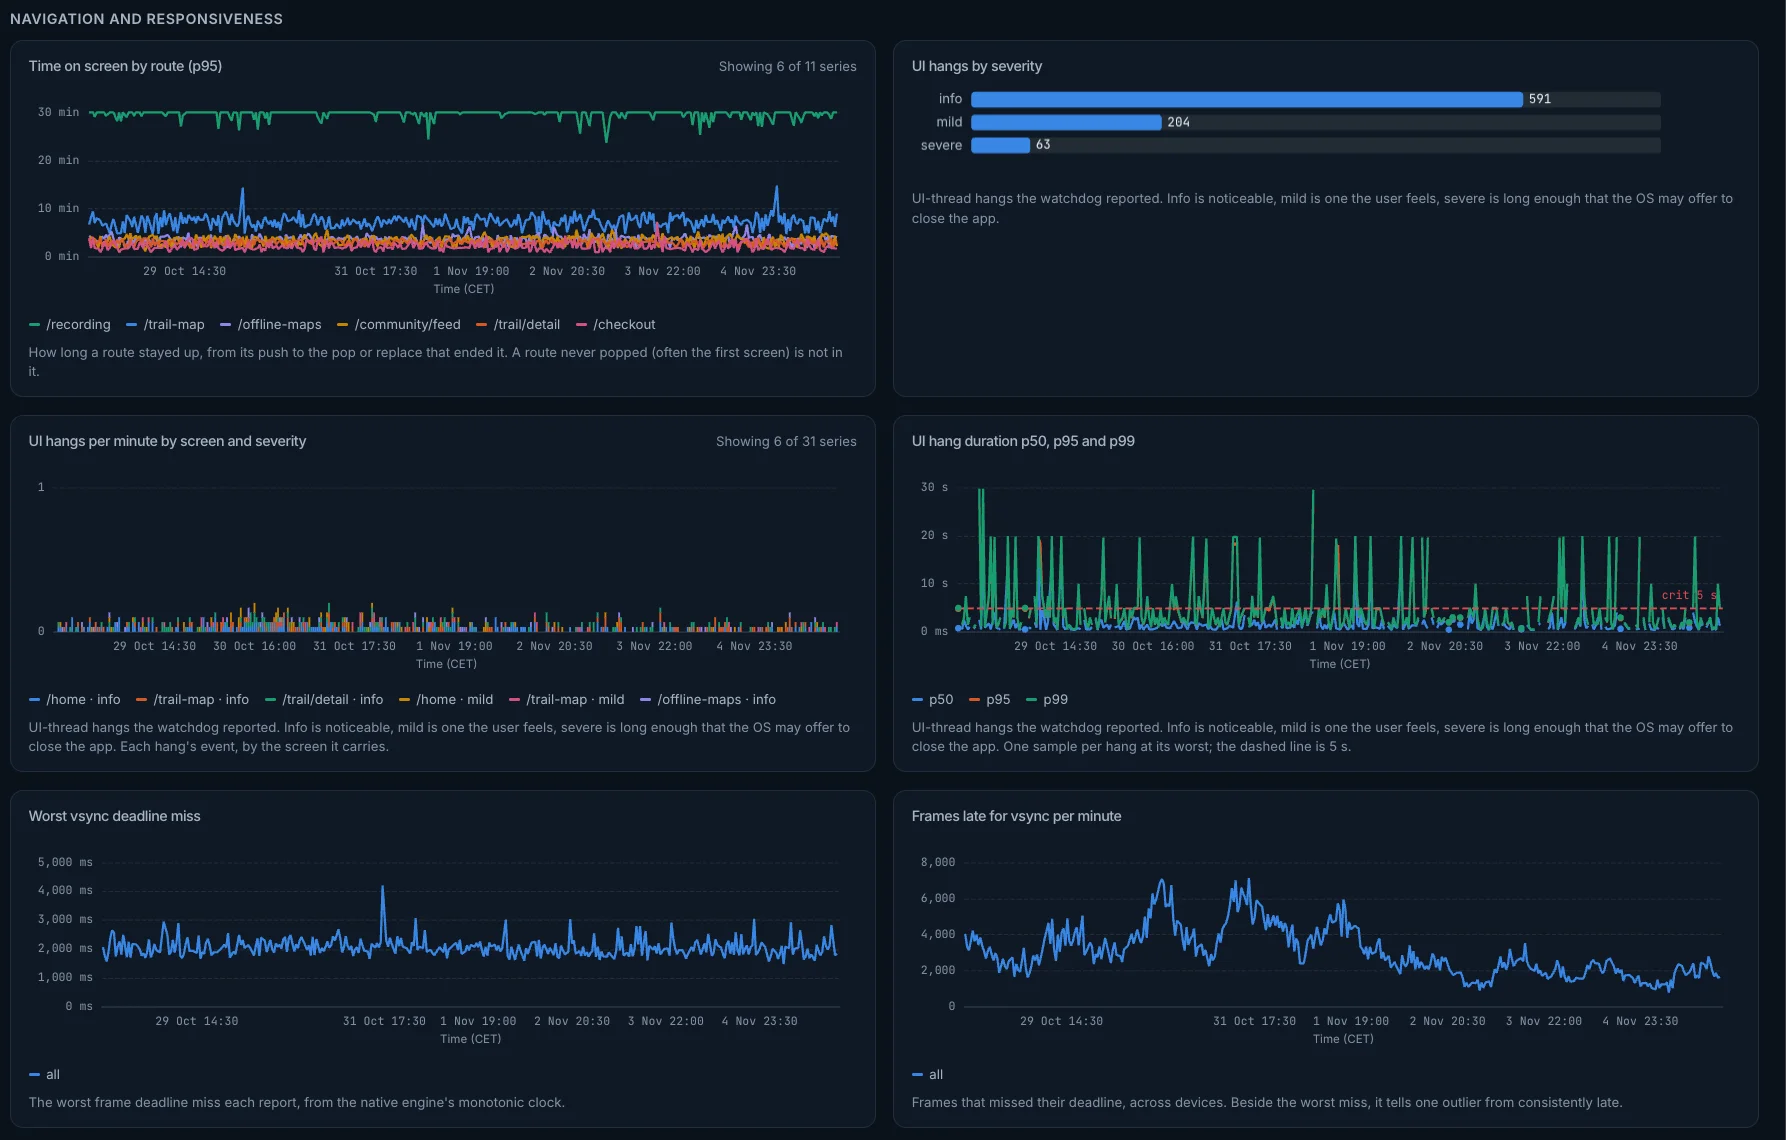
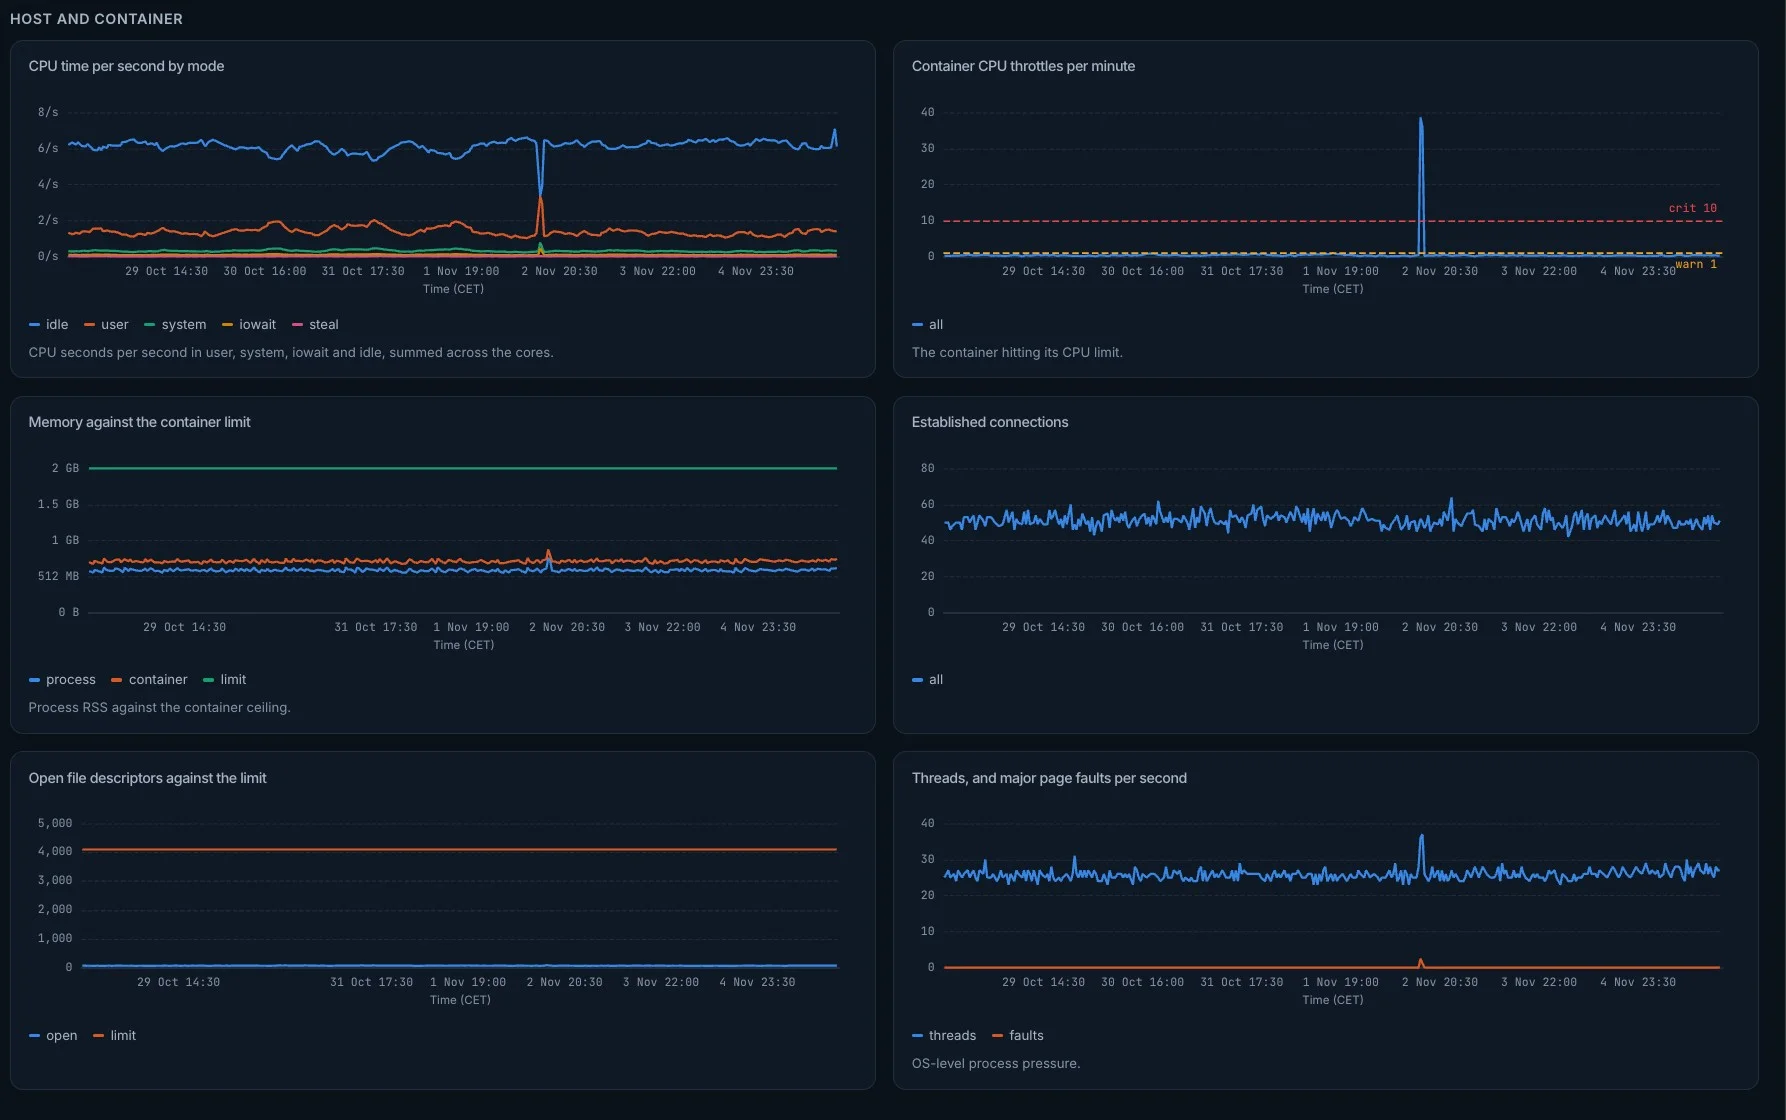
More dashboards, pre-loaded
No blank canvas: these ship with every Dartastic Observatory, Dedicated or Cloud.
Point your exporter. That's the setup.
Any OpenTelemetry SDK in any language can send to your Dartastic Observatory: your Flutter app, your Dart backend, your Go services. Mint an ingest key, set three environment variables, and telemetry flows.
# Cloud:  <your-org>.otlp.cloud.dartastic.io       Dedicated:  otlp.<your-slug>.dartastic.io
OTEL_EXPORTER_OTLP_ENDPOINT=https://<your-org>.otlp.cloud.dartastic.io:443
OTEL_EXPORTER_OTLP_PROTOCOL=http/protobuf   # the default; or: grpc
OTEL_EXPORTER_OTLP_HEADERS="authorization=Bearer <otlp-ingest-key>"
Dartastic Symbolizer integration makes errors easy.
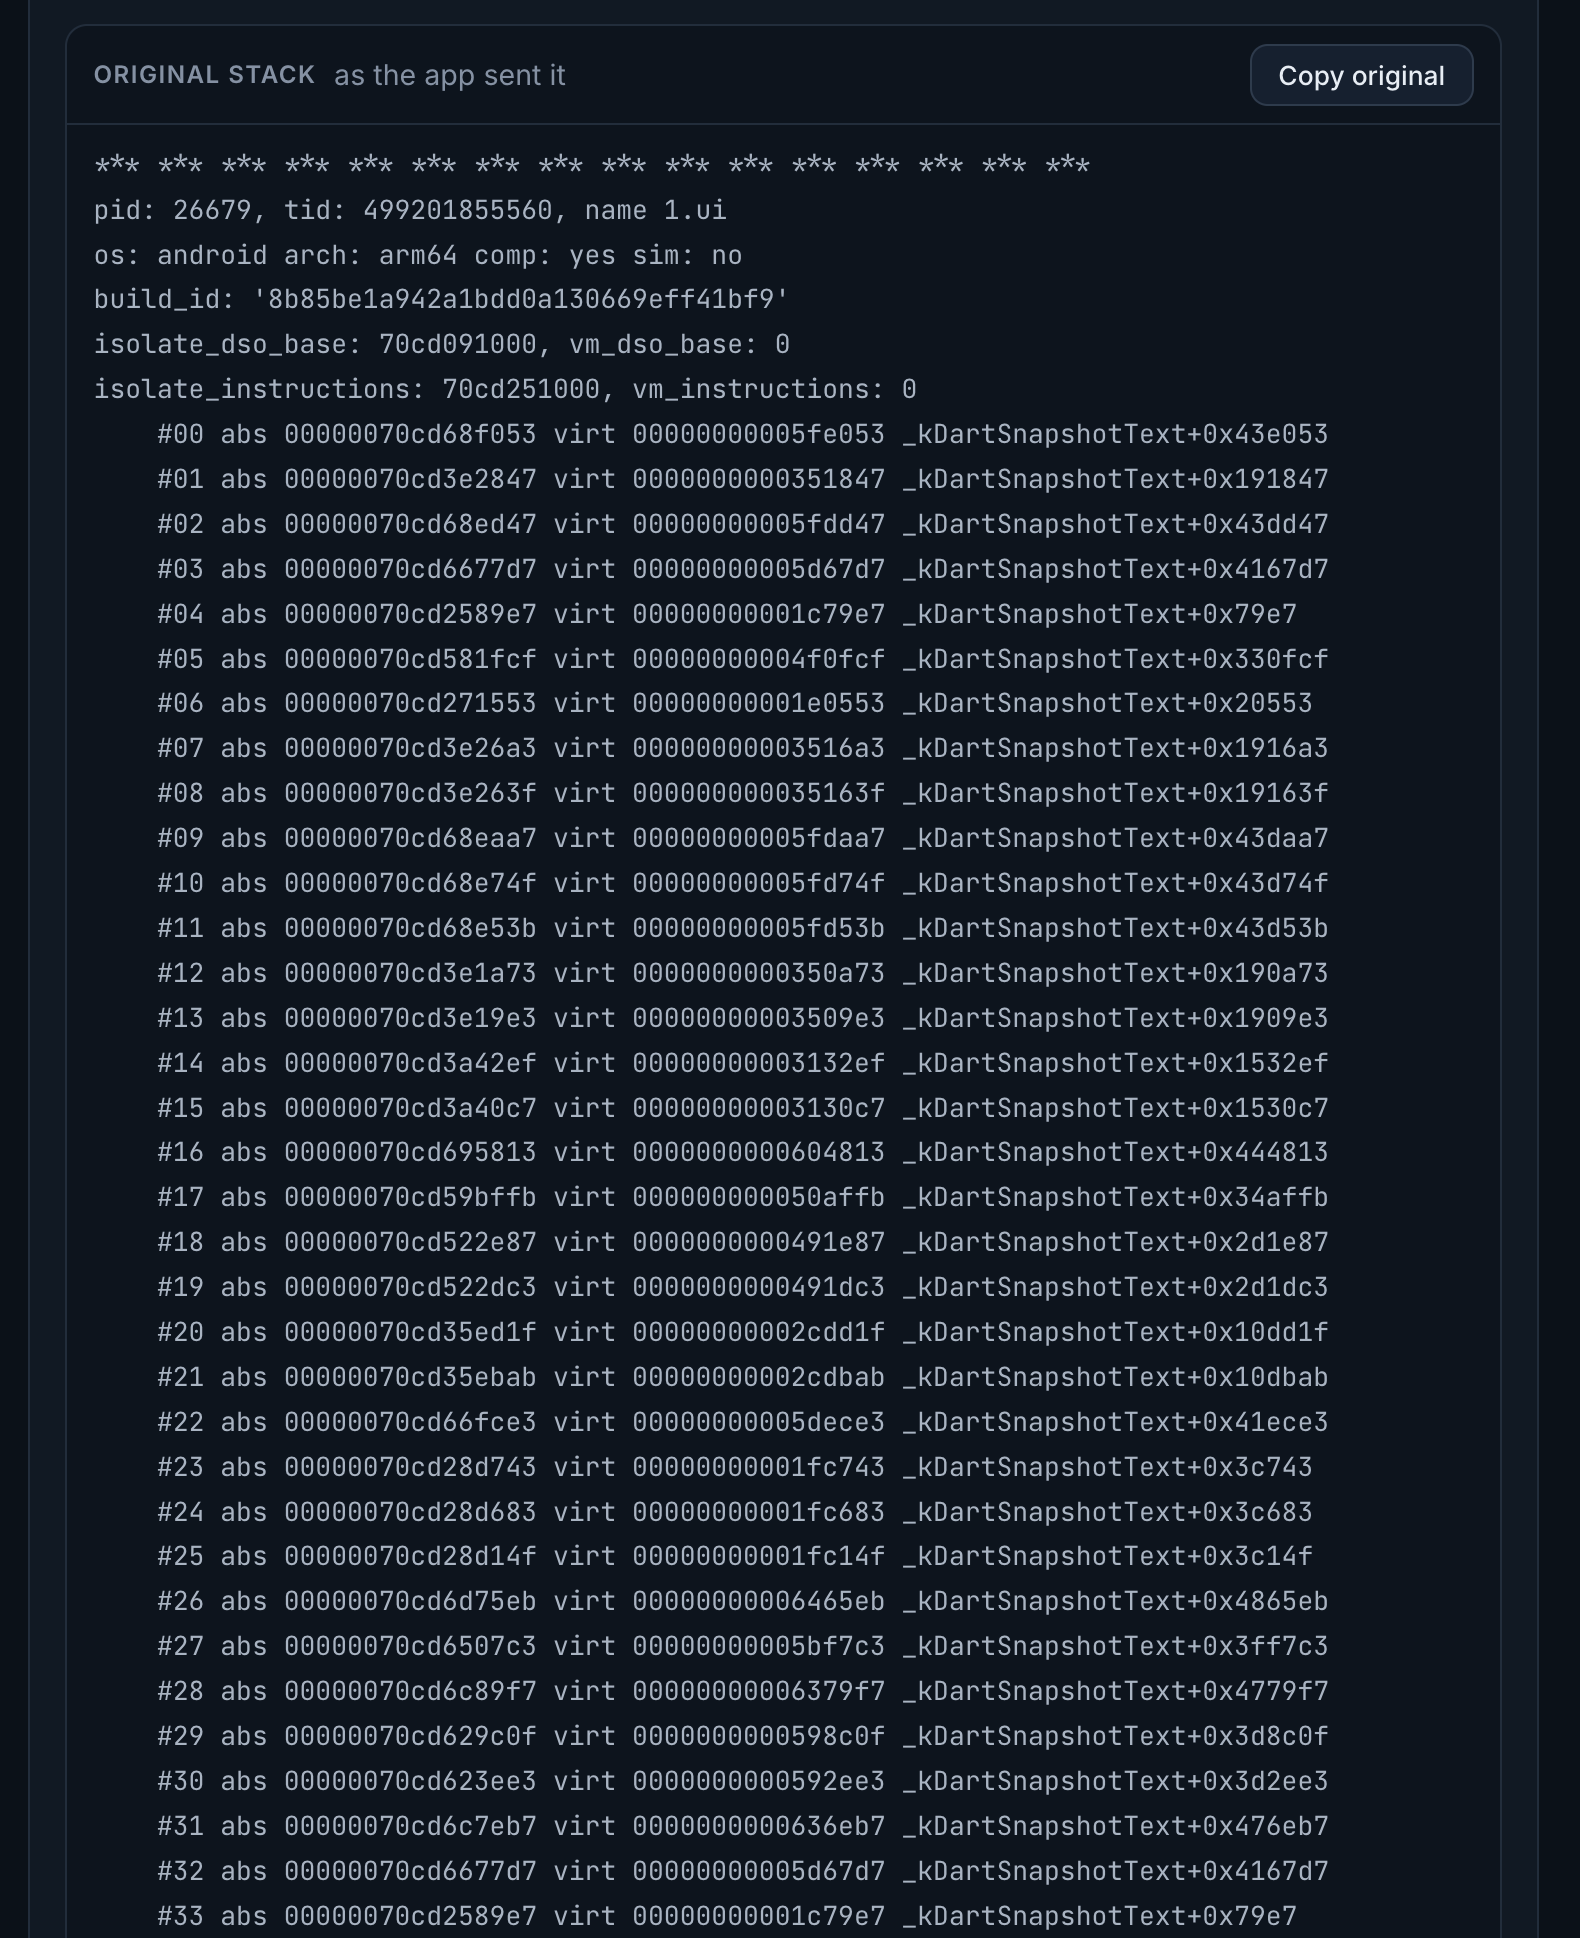
Production Flutter builds are binary and obfuscated, so errors are unusable. Production errors read like this: #00 abs 0000007a93f9d693 virt 00000000002a0693 _kDartSnapshotText+0x150693.
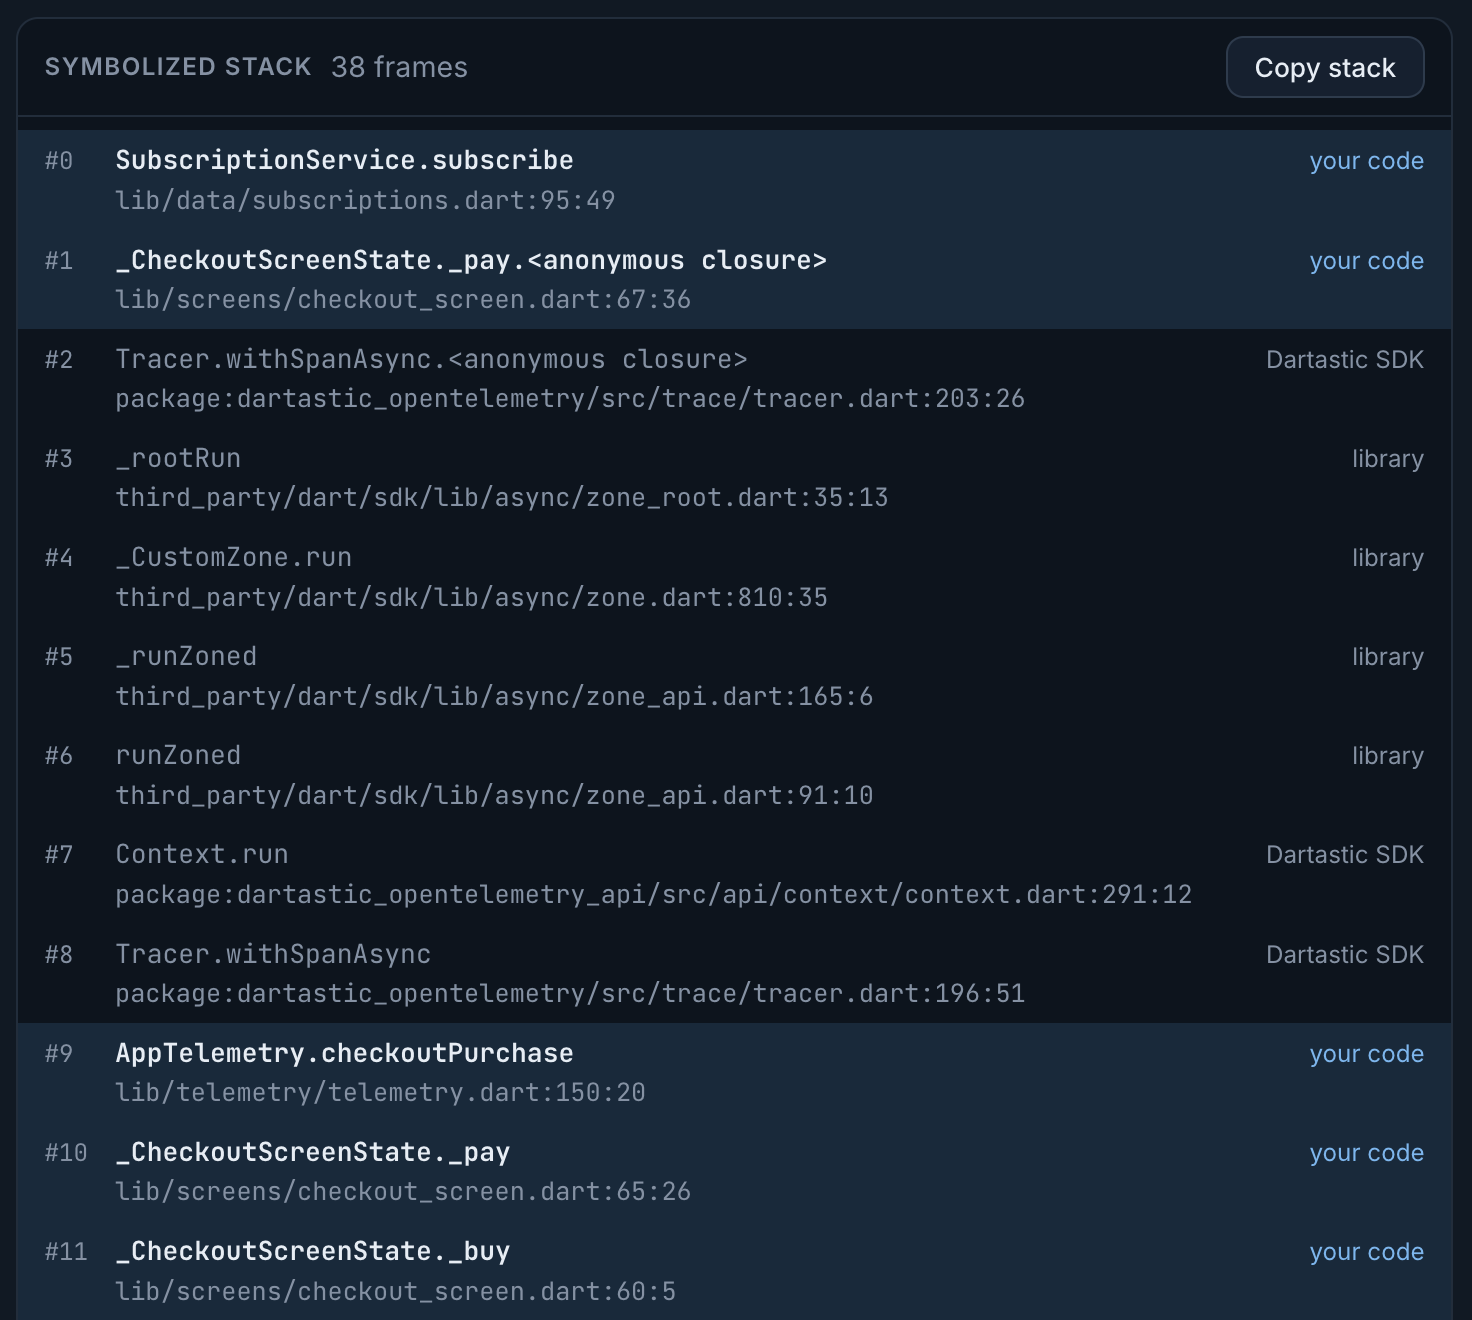
When Dartastic Observatory ingests an error trace, it calls Dartastic Symbolizer, which converts the binary error into a source code stack by referencing your private Dartastic Pub.
It's a seamless experience for DevOps. Errors appear inline in Dartastic Observatory. DevOps can create issues with the offending source code lines by simple copy and paste.
Dartastic AI also sees the errors, along with your source code in Dartastic Pub, and can propose code fixes and file them as issues that developers can use to heal the code and improve the user experience.
It's a seamless experience for developers. Debug symbols and source maps are published with your app to your private Dartastic Pub at build time.
Other vendors insist on a separate step, which is insecure and cumbersome: uploading each release's symbols, where they sit as another attack surface outside your perimeter. An attacker with your symbols can download your app and reconstruct its source code. For Dartastic Self-Hosted, the entire system sits inside your network.
Secured Pub Supply Chain, included.
Every Dartastic Observatory subscription comes with Dartastic Pub, a private package registry with security features to keep your organization and your customers safe. On Dedicated, it runs on your own platform; on Cloud, on shared, hard-isolated infrastructure.
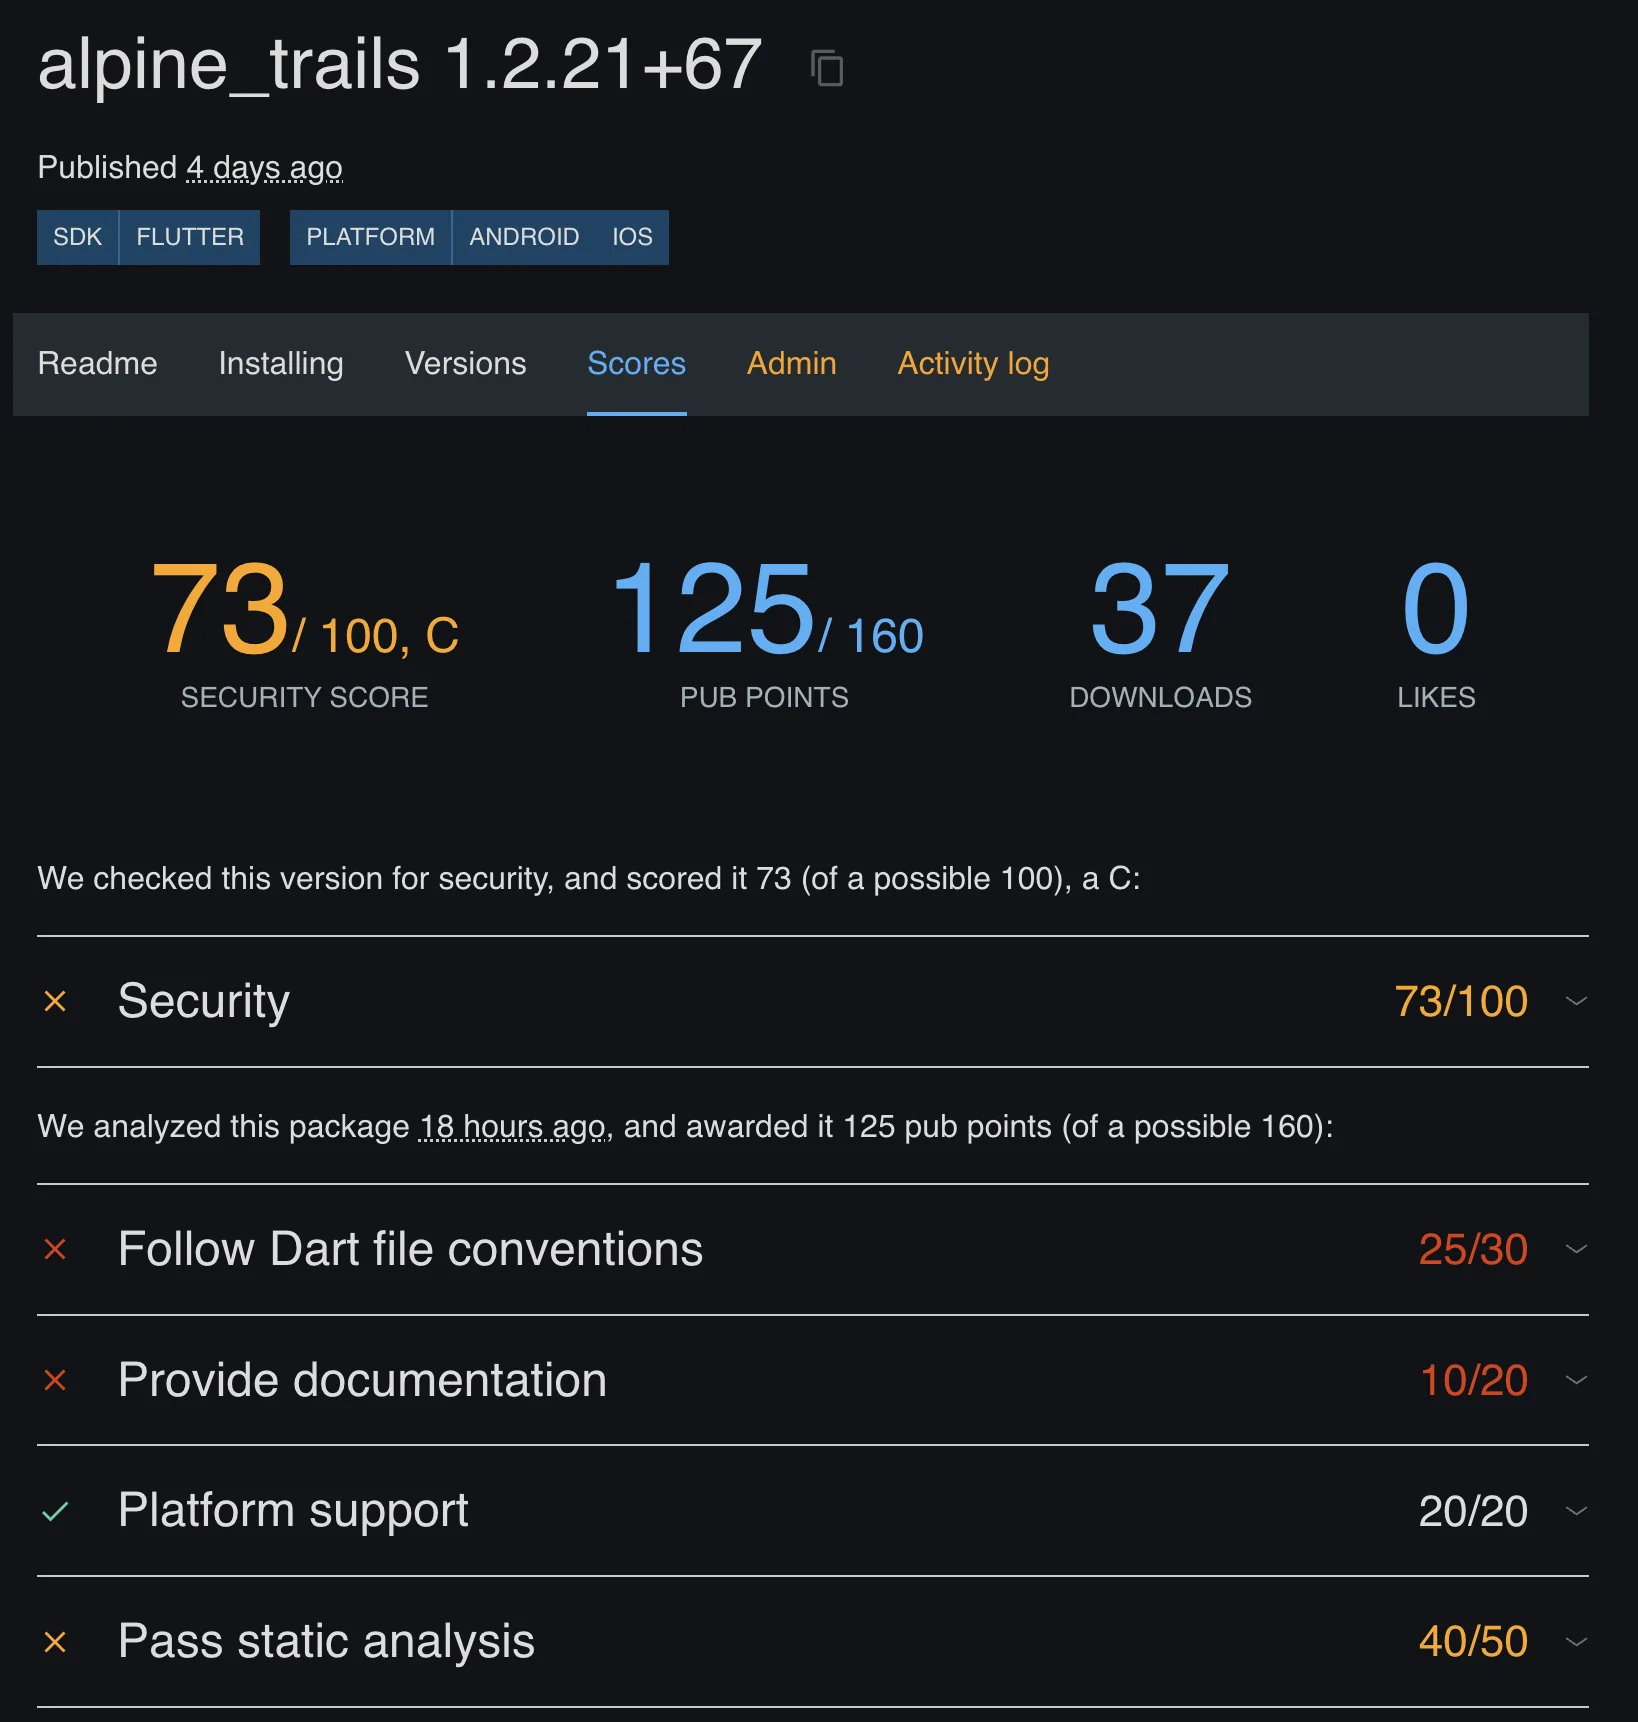
- The pub.dev workflow you already know.
dart pub publish, versions, changelogs, search. - Fine-grained access control. Per-team and per-package, with fast revocation.
- Where your debug symbols live. The Dartastic Symbolizer reads them from Pub, so your source map never leaves your infrastructure.
- Daily backups, dual-region storage.
Using Sentry? Keep your DSN.
Point your existing Sentry.init DSN at your Dartastic Observatory and its events, transactions, and sessions are translated to OpenTelemetry on arrival. Move to native OTel screen by screen, on your own schedule.
See Dartastic Observatory subscription tiers on dartastic.io/pricing.